Bitcoin Breaks Below Key Technical Indicator, but Appears Poised to Continue Its Flat Trajectory

Wednesday’s Federal Reserve likely decision to raise the interest rate 25 basis points appears to be priced into crypto markets
Bitcoin’s price broke below its lower range of a widely watched technical indicator on Monday, a day before the Federal Reserve began its latest two-day, monetary policy meeting. Whether the two events represent anything other than a mild coincidence is another story.
The U.S. central bank will likely raise interest rates 25 basis points (bps) on Wednesday.
Anyone following crypto markets has likely noticed bitcoin’s diminished reaction to macroeconomic events. The two most recent rate hikes in May and March resulted in relatively mild price moves of 1.13% and -2.87%. The reaction to recent inflation and GDP data was similar, with BTC moving just -0.74% and 1.16% respectively, following each occurrence..
All told, crypto markets have likely priced in tomorrow’s anticipated move.
More interesting for traders is BTC’s price declining below the lower range of its Bollinger Bands, an indication that its price may be set to move higher – albeit just slightly. Bollinger Bands are a technical indicator that tracks an asset’s 20-day moving average, and plots price levels two standard deviations above and below the average.
As an asset’s price is expected to stay within two standard deviations of its average, 95% of the time, a breach of the external bands is seen as statistically significant.
For BTC, traders may be eyeing an upside target of $30,000 level, which coincides with bitcoin’s 20-day moving average. A high volume area of activity is also in place at $30,000, implying that a healthy dose of price agreement exists at this level. Prices tend to move slowly in periods of high volume, implying that BTC is poised to increase slightly, but will run into overhead resistance following an advance.
And given recent decreased volatility, and a narrowing trading range, that leaves just 3% upside between curren t prices and the 20-day average.
The aggregate spread between current BTC prices and its 20-day average is approximately $900, outside bitcoin’s current average true range (ATR) of $737. The implication is that even a 3% price increase to its 20-day average would mildly increase bitcoin volatility.
On-chain data does not suggest that prices will move sharply. According to analytics firm , large crypto investors have continued to move their bitcoin from centralized exchanges.
While the trend may partly reflect a lack of confidence in centralized exchanges, bitcoin wallet balances have stayed fairly stable for both large and small investors, underscoring the current penchant for hodling and confidence in the asset.

This article was written and edited by CoinDesk journalists with the sole purpose of informing the reader with accurate information. If you click on a link from Glassnode, CoinDesk may earn a commission. For more, see our .
Edited by James Rubin.
Disclaimer: The content of this article solely reflects the author's opinion and does not represent the platform in any capacity. This article is not intended to serve as a reference for making investment decisions.
You may also like
U.S. November ADP employment change at -32K, vs. 10K expected and 42K prior.
Hyperliquid (HYPE) Price Fluctuations: Unraveling Blockchain Hazards and Institutional Confidence for 2025
- Hyperliquid (HYPE) dominates 73% of Perp DEX market share in 2025 through $5B TVL, BlackRock/Stripe partnerships, and 11% HLP returns despite security breaches. - Repeated 2025 security incidents ($4.9M POPCAT attack, $21M private key breach) triggered 20%+ price drops and $4B TVL decline amid liquidity flight. - Institutional trust persists as TVL/open interest grew post-March 2025, but circulating supply unlocks and Lighter/Aster competition threaten HYPE's $34 price stability. - Platform's success hin
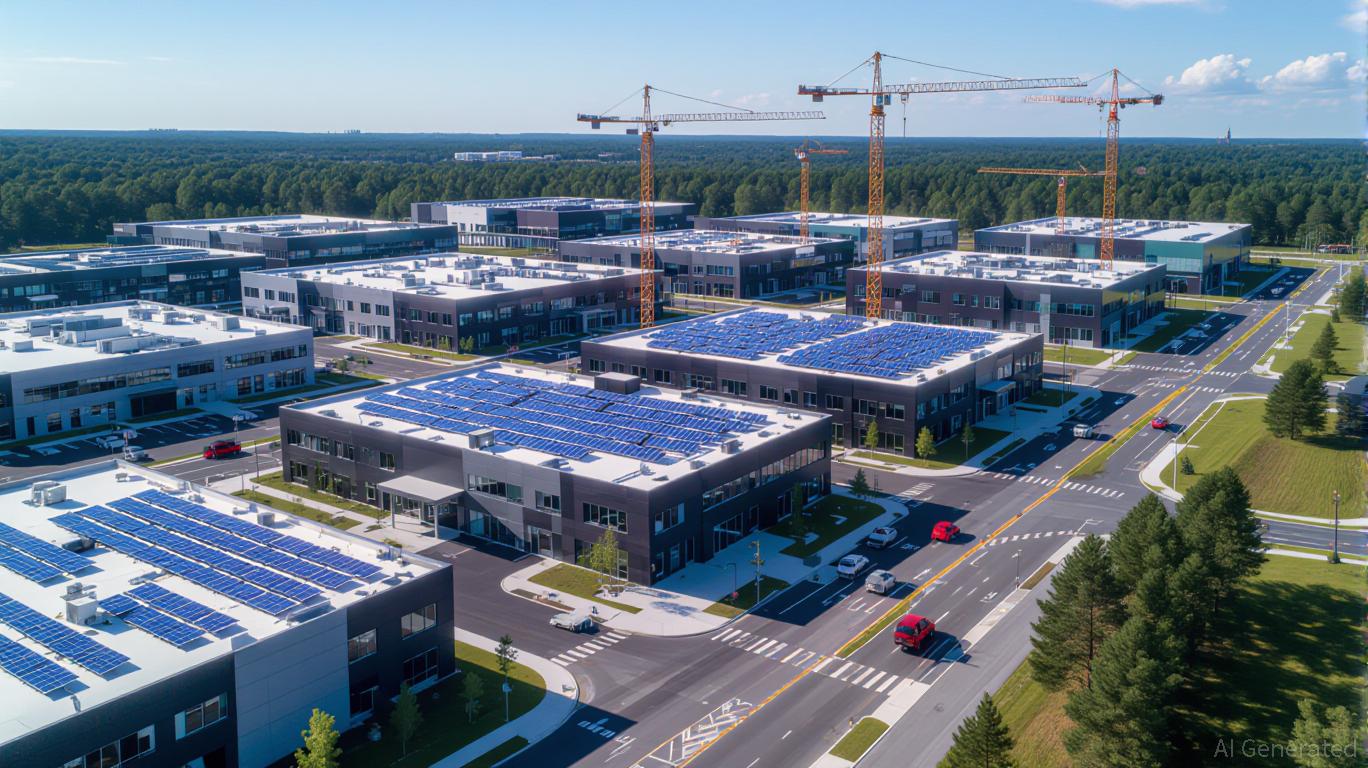
Strategic Property Investment in the Revitalization of the Former Xerox Campus: Infrastructure-Led Renewal in Webster, NY
- Webster , NY, is transforming its post-Xerox campus via $14.3M in state infrastructure grants for industrial upgrades and public-private partnerships. - Road, sewer, and electrical improvements reduced industrial vacancy to 2%, attracting $650M fairlife® dairy plant and 250 jobs. - Residential values rose 10.1% annually as NEAT corridor targets $1B in development by 2026 with $283M public-private investment. - Strategic infrastructure funding de-risks development, creating a scalable model for post-indus
3 Key Signals That Hint at a Near-Term Shiba Inu Upswing