
XRP’s Long-Term Breakout Narrative Builds Even As Short-Term Bears Linger

By:Newsbtc
XRP’s chart is telling a two-speed story right now. While short-term price action remains heavy and key resistance levels are still capping upside, the broader structure continues to quietly mature beneath the surface. This tension between near-term pressure and a slowly building macro setup is what makes the current phase especially critical for what comes next.
A Multi-Year Compression Is Reaching Its Endgame
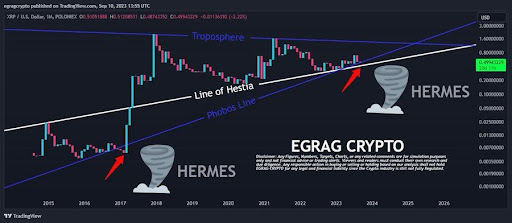
In a recent update, crypto analyst EGRAG CRYPTO emphasized that the XRP macro triangle is far more than just market noise; it is a definitive roadmap. Analyzing the asset on a 2-month timeframe, the analyst noted that this massive structural formation has been developing for years, serving as a primary indicator of where the price is headed in the long term.
EGRAG was among the first to identify this specific breakout setup in its early stages. What the broader market might view as stagnation or random volatility is a multi-year triangle reaching its final apex on the macro chart, signaling that a major move is being prepared.
var rnd = window.rnd || Math.floor(Math.random()*10e6); var pid607465 = window.pid607465 || rnd; var plc607465 = window.plc607465 || 0; var abkw = window.abkw || ''; var absrc = 'https://servedbyadbutler.com/adserve/;ID=172179;size=0x0;setID=607465;type=js;sw='+screen.width+';sh='+screen.height+';spr='+window.devicePixelRatio+';kw='+abkw+';pid='+pid607465+';place='+(plc607465++)+';rnd='+rnd+';click=CLICK_MACRO_PLACEHOLDER'; document.write('
');
if (!window.AdButler){(function(){var s = document.createElement("script"); s.async = true; s.type = "text/javascript";s.src = "https://servedbyadbutler.com/app.js";var n = document.getElementsByTagName("script")[0]; n.parentNode.insertBefore(s, n);}());}
var AdButler = AdButler || {}; AdButler.ads = AdButler.ads || []; var abkw = window.abkw || ""; var plc366606 = window.plc366606 || 0; (function(){ var divs = document.querySelectorAll(".plc366606:not([id])"); var div = divs[divs.length-1]; div.id = "placement_366606_"+plc366606; AdButler.ads.push({handler: function(opt){ AdButler.register(172179, 366606, [728,90], "placement_366606_"+opt.place, opt); }, opt: { place: plc366606++, keywords: abkw, domain: "servedbyadbutler.com", click:"CLICK_MACRO_PLACEHOLDER" }}); })();
 Source:
Chart from Egrga Crypto on X
Source:
Chart from Egrga Crypto on X
The analyst stressed that this technical preparation is not based on “hopium,” but on a disciplined interpretation of long-term price action. Basically, this macro view provides a structured look at the market, stripping away the distractions of lower timeframes to reveal the significant accumulation and pressure building within the triangle’s boundaries.
This tiered roadmap is designed to guide investors through the potential breakout phases, offering a strategic perspective on how XRP is expected to unfold as it finally exits this historic consolidation pattern.
Double Bottom Falters As Buyers Struggle To Follow Through
According to a post by Umair Crypto, the market is still showing signs of hesitation, with the double-bottom structure failing to gain meaningful traction. On the 4-hour chart, the recent bounce from the $1.84 area aligns closely with the golden pocket of the $1.772–$1.962 Fibonacci retracement, which helps explain the temporary reaction seen so far.
var rnd = window.rnd || Math.floor(Math.random()*10e6); var pid607472 = window.pid607472 || rnd; var plc607472 = window.plc607472 || 0; var abkw = window.abkw || ''; var absrc = 'https://servedbyadbutler.com/adserve/;ID=172179;size=0x0;setID=607472;type=js;sw='+screen.width+';sh='+screen.height+';spr='+window.devicePixelRatio+';kw='+abkw+';pid='+pid607472+';place='+(plc607472++)+';rnd='+rnd+';click=CLICK_MACRO_PLACEHOLDER'; document.write('
');
if (!window.AdButler){(function(){var s = document.createElement("script"); s.async = true; s.type = "text/javascript";s.src = "https://servedbyadbutler.com/app.js";var n = document.getElementsByTagName("script")[0]; n.parentNode.insertBefore(s, n);}());}
var AdButler = AdButler || {}; AdButler.ads = AdButler.ads || []; var abkw = window.abkw || ""; var plc452518 = window.plc452518 || 0; (function(){ var divs = document.querySelectorAll(".plc452518:not([id])"); var div = divs[divs.length-1]; div.id = "placement_452518_"+plc452518; AdButler.ads.push({handler: function(opt){ AdButler.register(172179, 452518, [728,90], "placement_452518_"+opt.place, opt); }, opt: { place: plc452518++, keywords: abkw, domain: "servedbyadbutler.com", click:"CLICK_MACRO_PLACEHOLDER" }}); })();
Why The Current XRP Valuation Doesn’t Make Sense
For momentum to shift, price needs to start closing above the $1.96 level. A move beyond that zone would allow the daily RSI trendlines to flip, marking the first real step toward regaining bullish momentum. The next and more critical hurdle sits at the $2.00 mark, where a breakout would also mean reclaiming the daily 50 SMA, a key signal that bullish structure is returning.
Until those resistance crucial levels are recovered, the broader outlook remains bearish. Thus, the altcoin is vulnerable to further downside, and the risk of printing lower lows stays on the table as long as buyers fail to assert control above these key thresholds.
 XRP trading at $1.87 on the 1D chart | Source: XRPUSDT on
Tradingview.com
XRP trading at $1.87 on the 1D chart | Source: XRPUSDT on
Tradingview.com
0
0
Disclaimer: The content of this article solely reflects the author's opinion and does not represent the platform in any capacity. This article is not intended to serve as a reference for making investment decisions.
PoolX: Earn new token airdrops
Lock your assets and earn 10%+ APR
Lock now!
You may also like
Circle Refutes Tokenized Metals Swap via USDC Reports
AiCryptoCore•2025/12/26 22:22

Gary Cardone Predicts Bitcoin Reaching $200K by 2025
AiCryptoCore•2025/12/26 22:22

S&P 500 Achieves Record Close on Christmas Eve 2025
AiCryptoCore•2025/12/26 22:22

New Jersey Pension Fund Expands MicroStrategy Stake to Boost Bitcoin Exposure
BlockchainReporter•2025/12/26 22:00
Trending news
MoreCrypto prices
MoreBitcoin
BTC
$87,284.57
-0.35%
Ethereum
ETH
$2,923.19
-0.07%
Tether USDt
USDT
$0.9992
-0.01%
BNB
BNB
$833.77
-0.59%
XRP
XRP
$1.84
-0.66%
USDC
USDC
$0.9996
-0.01%
Solana
SOL
$121.89
-0.52%
TRON
TRX
$0.2793
+0.11%
Dogecoin
DOGE
$0.1218
-3.10%
Cardano
ADA
$0.3493
-1.02%
How to buy BTC
Bitget lists BTC – Buy or sell BTC quickly on Bitget!
Trade now
Become a trader now?A welcome pack worth 6200 USDT for new users!
Sign up now