
When Will Bitcoin Bottom? History Points To October 2026, Says Analyst

By:Newsbtc
An analyst has explained when Bitcoin could possibly reach a bottom, based on the historical pattern followed by its price across cycles.
Bitcoin Has Tended To Take 364 Days From Major Tops To Bottoms
In a new thread on X, analyst Ali Martinez has discussed about what history could hint about when Bitcoin might reach a bottom in the current cycle. “Bitcoin $BTC major cycles have followed a surprisingly consistent rhythm, both in timing and depth,” noted Martinez.

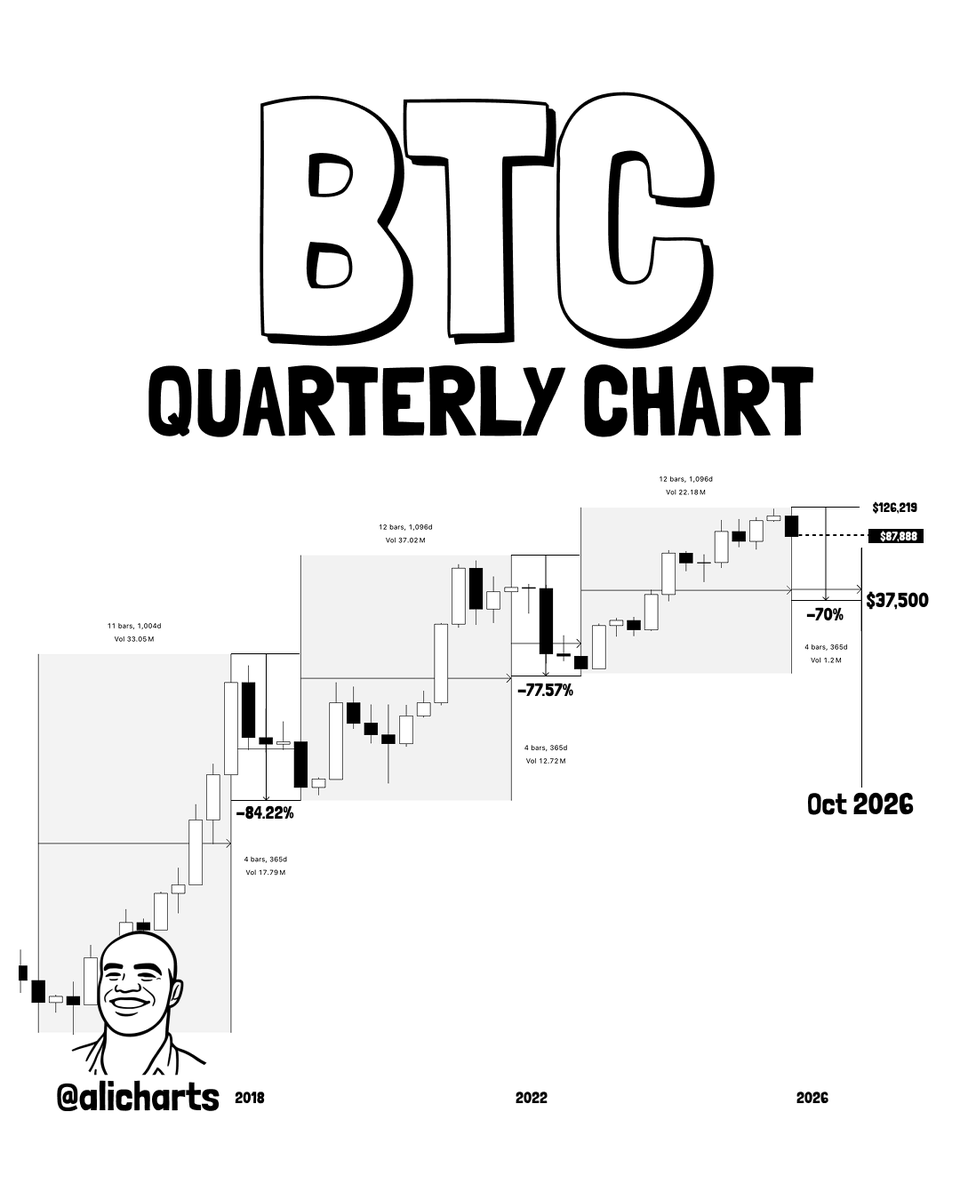
Below is a chart shared by the analyst that highlights some of the similarities that the last few BTC cycles have shared.
var rnd = window.rnd || Math.floor(Math.random()*10e6); var pid607465 = window.pid607465 || rnd; var plc607465 = window.plc607465 || 0; var abkw = window.abkw || ''; var absrc = 'https://servedbyadbutler.com/adserve/;ID=172179;size=0x0;setID=607465;type=js;sw='+screen.width+';sh='+screen.height+';spr='+window.devicePixelRatio+';kw='+abkw+';pid='+pid607465+';place='+(plc607465++)+';rnd='+rnd+';click=CLICK_MACRO_PLACEHOLDER'; document.write('
');
if (!window.AdButler){(function(){var s = document.createElement("script"); s.async = true; s.type = "text/javascript";s.src = "https://servedbyadbutler.com/app.js";var n = document.getElementsByTagName("script")[0]; n.parentNode.insertBefore(s, n);}());}
var AdButler = AdButler || {}; AdButler.ads = AdButler.ads || []; var abkw = window.abkw || ""; var plc366606 = window.plc366606 || 0; (function(){ var divs = document.querySelectorAll(".plc366606:not([id])"); var div = divs[divs.length-1]; div.id = "placement_366606_"+plc366606; AdButler.ads.push({handler: function(opt){ AdButler.register(172179, 366606, [728,90], "placement_366606_"+opt.place, opt); }, opt: { place: plc366606++, keywords: abkw, domain: "servedbyadbutler.com", click:"CLICK_MACRO_PLACEHOLDER" }}); })();
 The cycles followed by the quarterly price of BTC | Source:
@alicharts on X
The cycles followed by the quarterly price of BTC | Source:
@alicharts on X
As is visible in the graph, the quarterly price of Bitcoin has taken roughly 1,064 days to reach the top from the bottom of the previous bear market during the last three cycles. This is naturally assuming that the cryptocurrency’s high above $126,000 was the top for the current cycle.
The distance from the top to the next bottom was also similar in the 2017 and 2021 cycles on the cryptocurrency’s quarterly chart, coming at about 364 days. “If this pattern holds, Bitcoin $BTC is now inside that 364-day correction window, which points to a potential bottom around October 2026,” explained Martinez.
In the chart, the analyst has also highlighted a possible bottom target for Bitcoin, based on, once again, the pattern from the previous cycles. The 2018 bear market reached its low after a drawdown of 84.22% from the bull market top, while the 2022 bear involved a decline of 77.57%.
var rnd = window.rnd || Math.floor(Math.random()*10e6); var pid607472 = window.pid607472 || rnd; var plc607472 = window.plc607472 || 0; var abkw = window.abkw || ''; var absrc = 'https://servedbyadbutler.com/adserve/;ID=172179;size=0x0;setID=607472;type=js;sw='+screen.width+';sh='+screen.height+';spr='+window.devicePixelRatio+';kw='+abkw+';pid='+pid607472+';place='+(plc607472++)+';rnd='+rnd+';click=CLICK_MACRO_PLACEHOLDER'; document.write('
');
if (!window.AdButler){(function(){var s = document.createElement("script"); s.async = true; s.type = "text/javascript";s.src = "https://servedbyadbutler.com/app.js";var n = document.getElementsByTagName("script")[0]; n.parentNode.insertBefore(s, n);}());}
var AdButler = AdButler || {}; AdButler.ads = AdButler.ads || []; var abkw = window.abkw || ""; var plc452518 = window.plc452518 || 0; (function(){ var divs = document.querySelectorAll(".plc452518:not([id])"); var div = divs[divs.length-1]; div.id = "placement_452518_"+plc452518; AdButler.ads.push({handler: function(opt){ AdButler.register(172179, 452518, [728,90], "placement_452518_"+opt.place, opt); }, opt: { place: plc452518++, keywords: abkw, domain: "servedbyadbutler.com", click:"CLICK_MACRO_PLACEHOLDER" }}); })();
Martinez has drawn a drawdown of 70% for the current cycle, which would put the price target at the $37,500 level. It now remains to be seen whether this cycle will follow a trajectory anything like the last cycles or if the asset will go a different direction this time around.
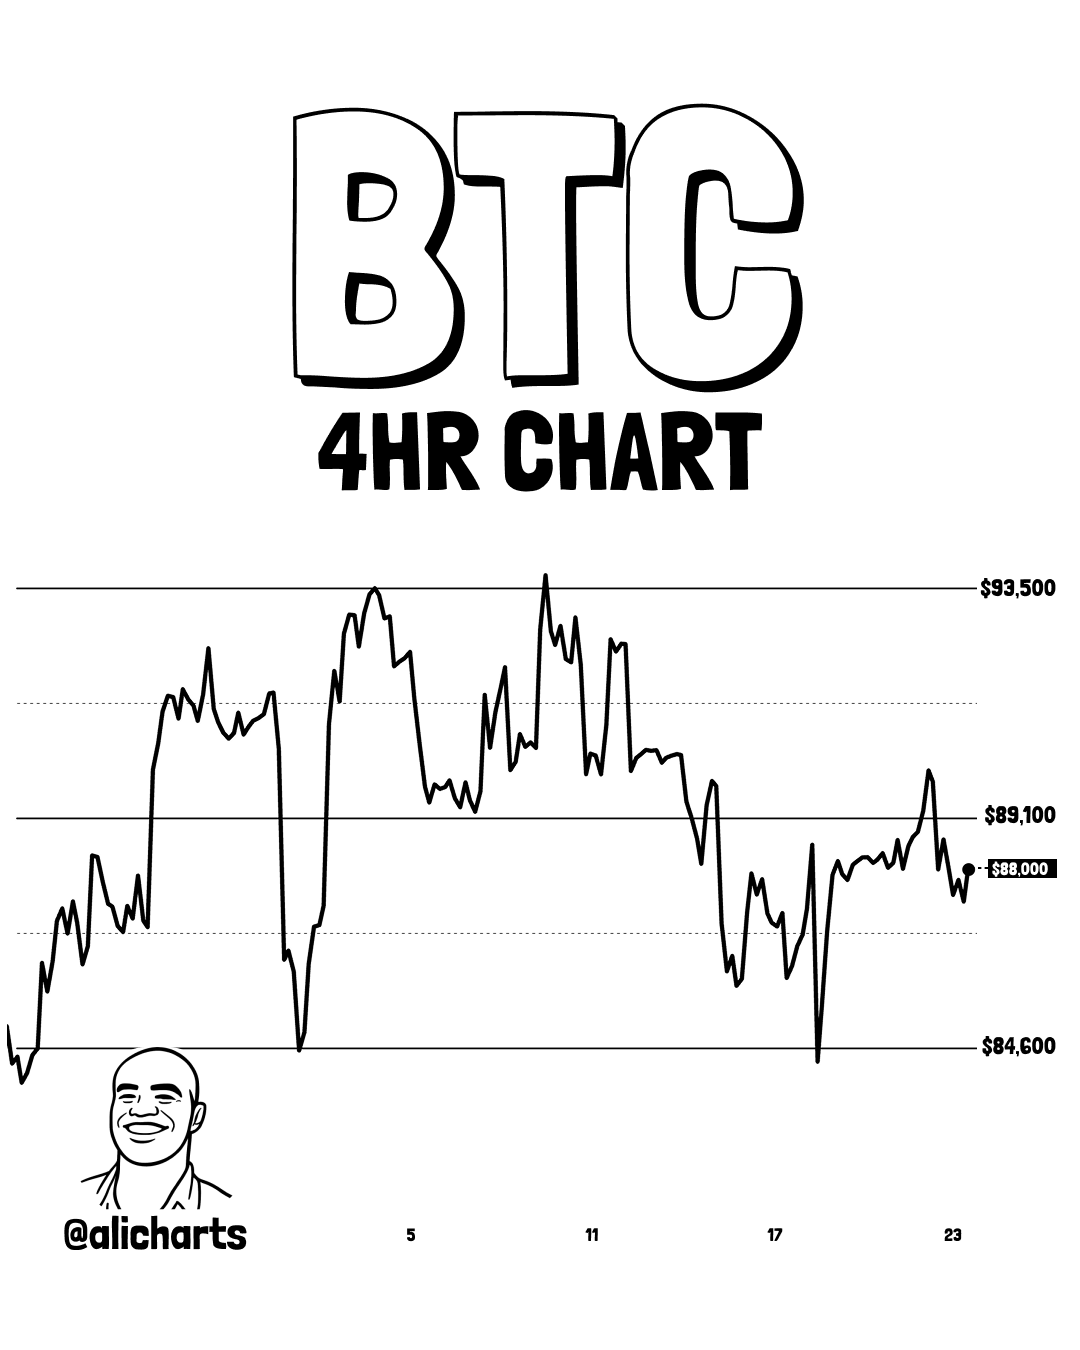
The chart for the Bitcoin cycles is showcasing the long-term trend of the asset using its quarterly price, but what about the short-term direction? In another X post, the analyst has shared the 4-hour chart for BTC, highlighting a technical analysis (TA) pattern forming on a short scale.
 The pattern that the 4-hour price of BTC has recently been trading inside | Source:
@alicharts on X
The pattern that the 4-hour price of BTC has recently been trading inside | Source:
@alicharts on X
As displayed in the above chart, Bitcoin has potentially been following a Parallel Channel on its 4-hour price during the last few weeks. A Parallel Channel appears whenever an asset observes consolidation between two parallel trendlines, with the lower level acting as support and upper one as resistance.
var rnd = window.rnd || Math.floor(Math.random()*10e6); var pid607473 = window.pid607473 || rnd; var plc607473 = window.plc607473 || 0; var abkw = window.abkw || ''; var absrc = 'https://servedbyadbutler.com/adserve/;ID=172179;size=0x0;setID=607473;type=js;sw='+screen.width+';sh='+screen.height+';spr='+window.devicePixelRatio+';kw='+abkw+';pid='+pid607473+';place='+(plc607473++)+';rnd='+rnd+';click=CLICK_MACRO_PLACEHOLDER'; document.write('
');
if (!window.AdButler){(function(){var s = document.createElement("script"); s.async = true; s.type = "text/javascript";s.src = 'https://servedbyadbutler.com/app.js';var n = document.getElementsByTagName("script")[0]; n.parentNode.insertBefore(s, n);}());}
var AdButler = AdButler || {}; AdButler.ads = AdButler.ads || []; var abkw = window.abkw || ''; var plc452519 = window.plc452519 || 0; (function(){ var divs = document.querySelectorAll(".plc452519:not([id])"); var div = divs[divs.length-1]; div.id = "placement_452519_"+plc452519; AdButler.ads.push({handler: function(opt){ AdButler.register(172179, 452519, [728,90], 'placement_452519_'+opt.place, opt); }, opt: { place: plc452519++, keywords: abkw, domain: 'servedbyadbutler.com', click:'CLICK_MACRO_PLACEHOLDER' }}); })();

Bitcoin Perps Heat Up Again As Leveraged Longs Rise
The cryptocurrency retested the lower line of this Parallel Channel last week, which led to a rebound as support held up. The asset has since returned to the middle zone of the pattern, suggesting there isn’t any clear bias in either direction right now.
BTC Price
At the time of writing, Bitcoin is floating around $87,300, up 0.7% in the last seven days.
 The trend in the price of the coin over the last five days | Source:
BTCUSDT on TradingView
The trend in the price of the coin over the last five days | Source:
BTCUSDT on TradingView
0
0
Disclaimer: The content of this article solely reflects the author's opinion and does not represent the platform in any capacity. This article is not intended to serve as a reference for making investment decisions.
PoolX: Earn new token airdrops
Lock your assets and earn 10%+ APR
Lock now!
You may also like
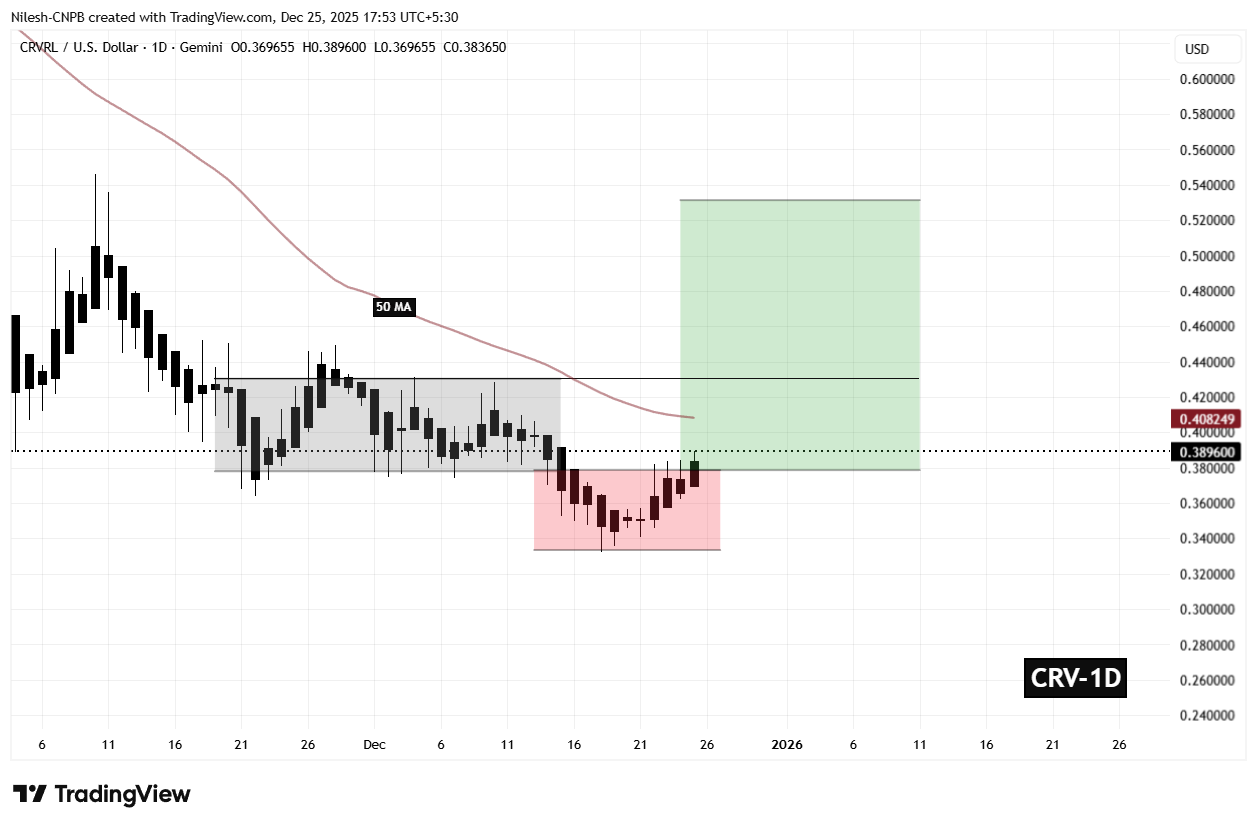
Curve DAO Token (CRV) To Soar Higher? Key Pattern Formation Suggests Potential Upside Move
Coinsprobe•2025/12/25 12:30
Hoskinson Blames Account-Based Blockchains for $50M Address Poisoning Scam
Coinedition•2025/12/25 12:27
$6 Billion In Ethereum Options: What This Means For Price
Newsbtc•2025/12/25 12:06

Hyperliquid Says Former Employee Was Behind HYPE Shorting
Cryptotale•2025/12/25 12:00
Trending news
MoreCrypto prices
MoreBitcoin
BTC
$87,483.9
+0.26%
Ethereum
ETH
$2,924.98
-0.15%
Tether USDt
USDT
$0.9994
-0.00%
BNB
BNB
$836.76
-0.12%
XRP
XRP
$1.86
-0.33%
USDC
USDC
$0.9997
-0.01%
Solana
SOL
$121.8
-0.29%
TRON
TRX
$0.2786
-1.58%
Dogecoin
DOGE
$0.1263
-1.27%
Cardano
ADA
$0.3506
-2.12%
How to buy BTC
Bitget lists BTC – Buy or sell BTC quickly on Bitget!
Trade now
Become a trader now?A welcome pack worth 6200 USDT for new users!
Sign up now