
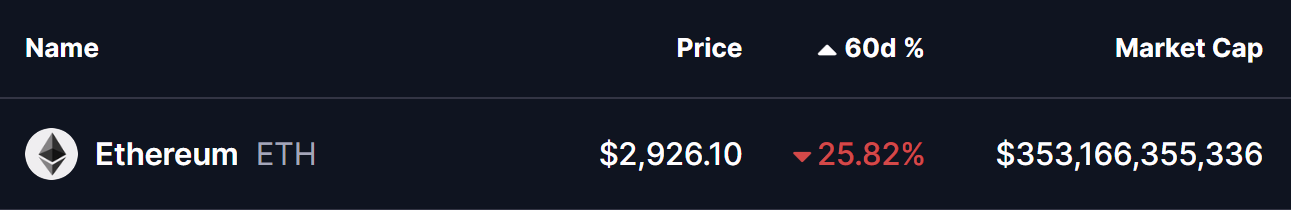
The broader crypto market has continued to experience choppy and indecisive price action over the past several weeks, a phase that began after the sharp sell-off on October 10. That correction dragged Ethereum (ETH) down from the sub-$4,700 region into the $2,900 area, keeping traders cautious and risk appetite muted across the market. Over the past 60 days alone, ETH has declined by more than 25%, reinforcing a short-term bearish bias.
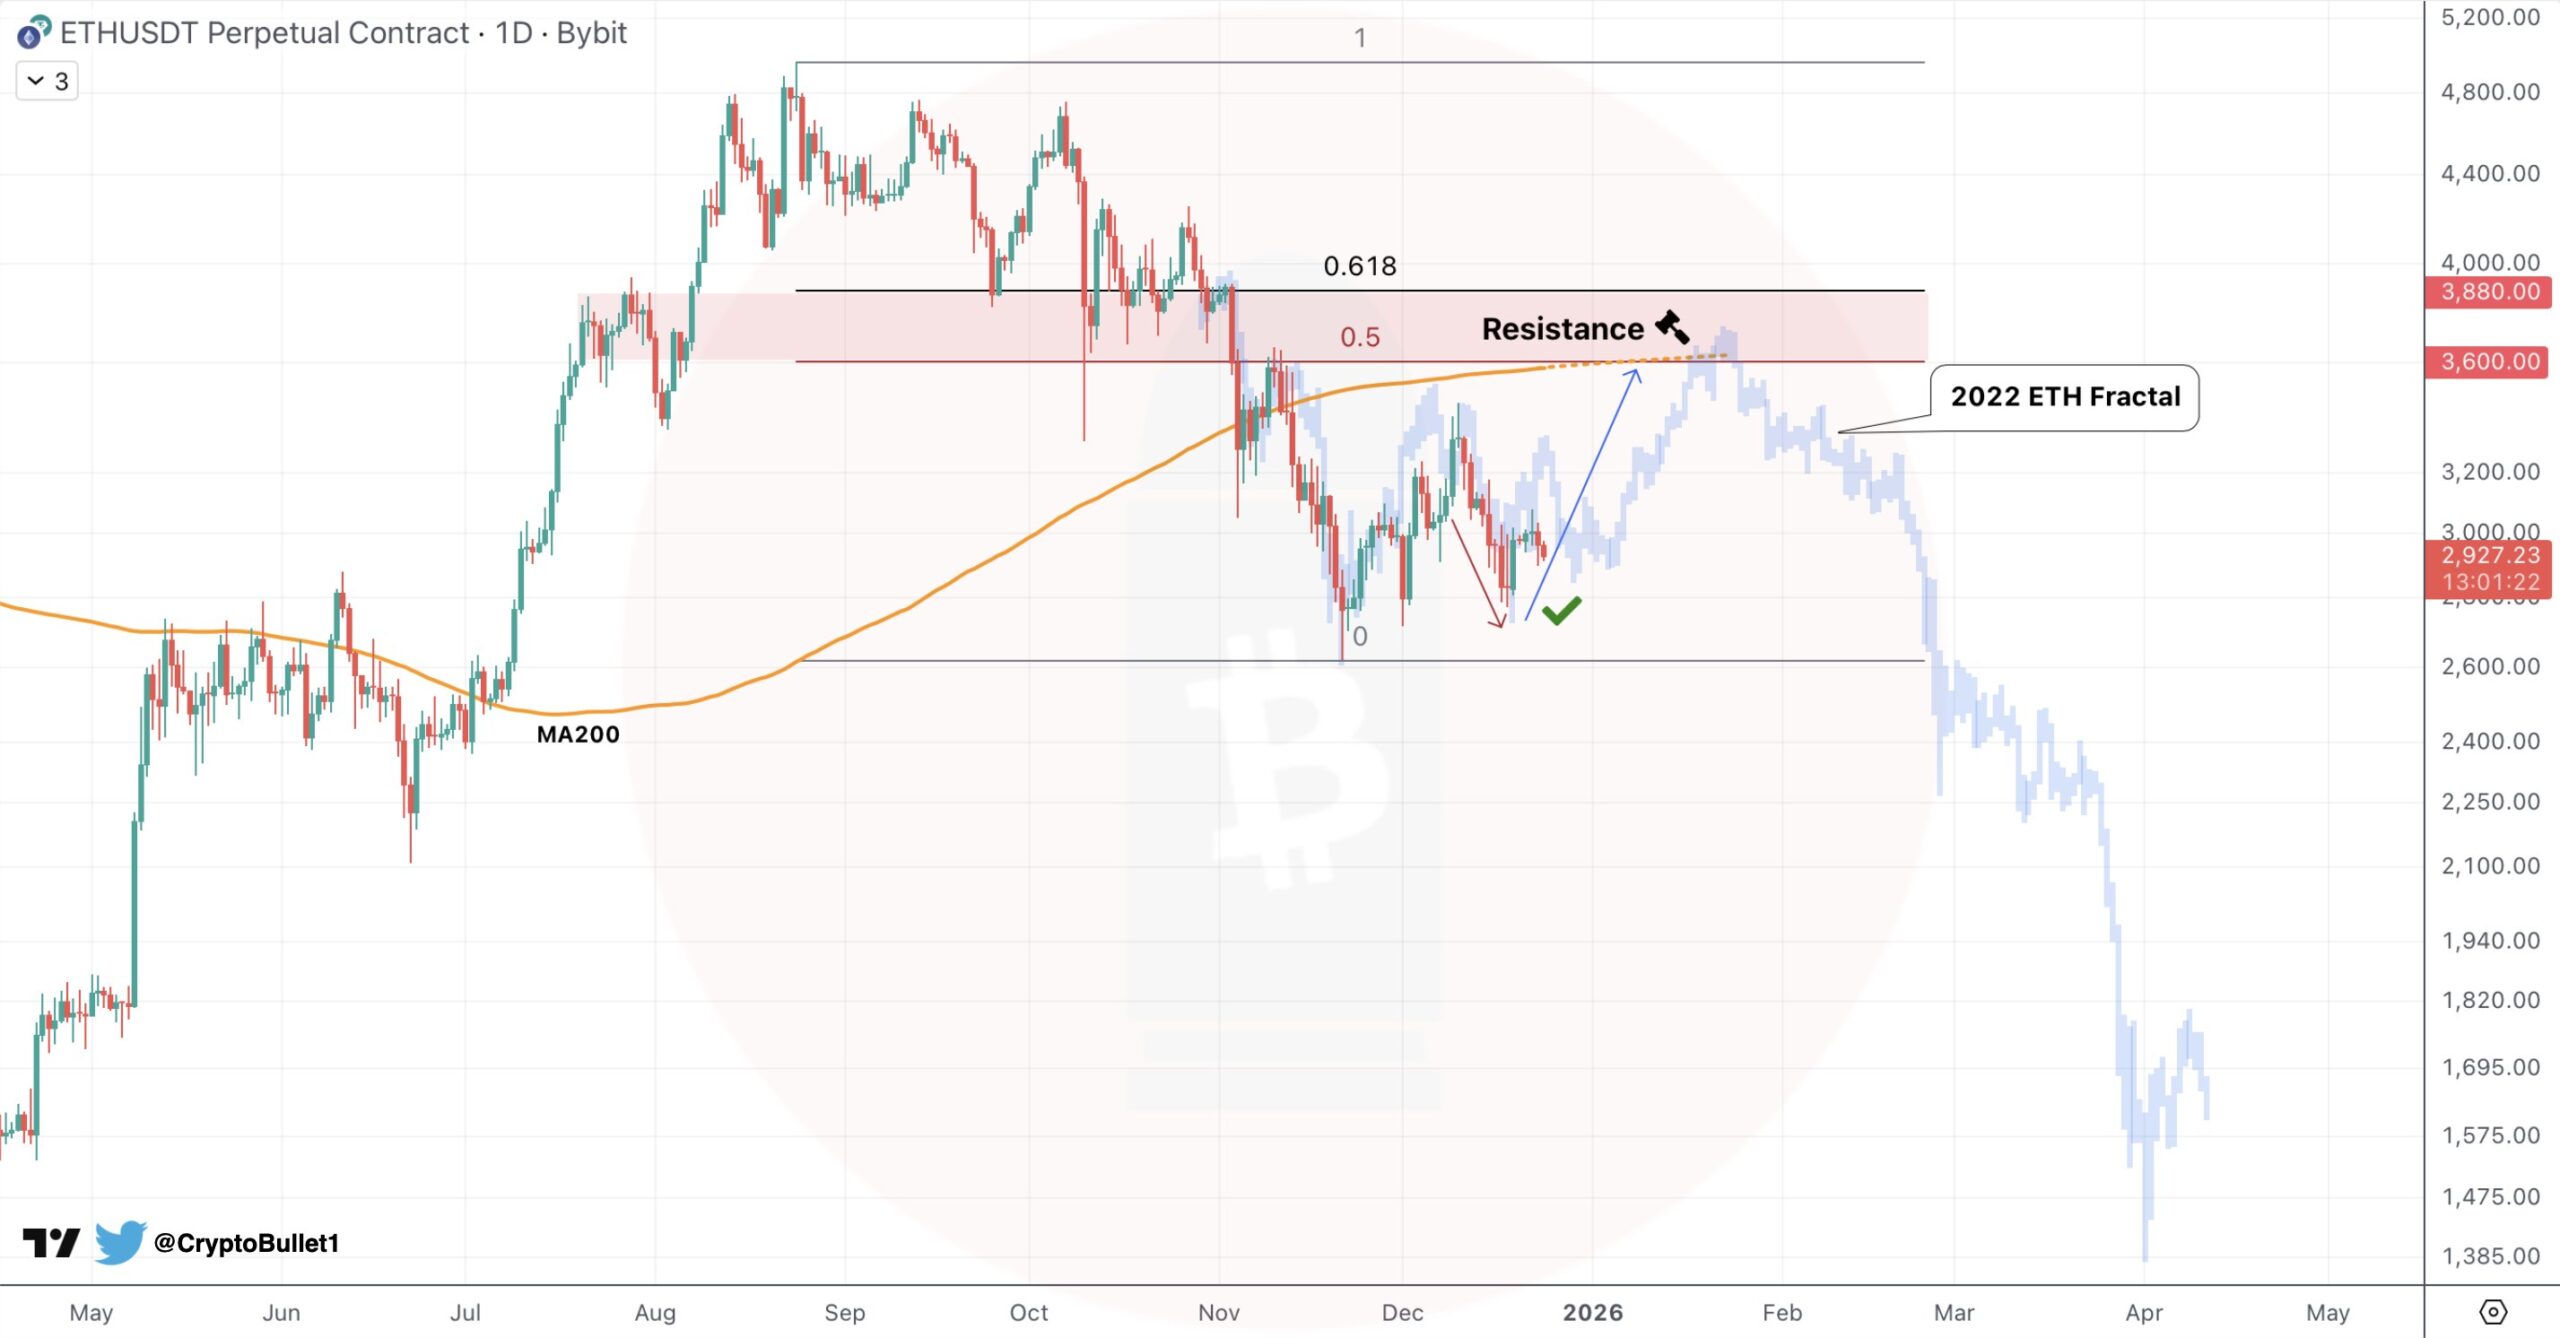
However, while near-term sentiment remains fragile, the higher-timeframe structure is beginning to hint that Ethereum may be approaching a pivotal moment. The daily chart is now displaying a price sequence that closely resembles ETH’s 2022 fractal — a setup that initially produced a relief rally before the broader trend resolved lower.
 Source: Coinmarketcap
Fractal Setup Hints at a Bounce
On the daily chart shared by crypto analyst CryptoBullet, Ethereum’s current price action mirrors the structure seen during the 2022 corrective phase. Back then, ETH experienced a sharp sell-off, followed by a period of consolidation near the local lows. That stabilization was followed by a corrective bounce toward a major resistance cluster defined by the 0.5–0.618 Fibonacci retracement zone and the 200-day moving average.
A similar dynamic appears to be unfolding now. ETH recently swept liquidity near the $2,700–$2,800 region, marking a potential short-term bottom. Since then, price has begun to stabilize, suggesting that downside momentum may be slowing. The fractal overlay on the chart points toward a potential rebound phase, with price gravitating back toward overhead resistance rather than breaking down immediately.
 ETH Fractal Chart/Credits: @CryptoBullet1 (X)
Crucially, the chart highlights a strong resistance zone between $3,600 and $3,880, where the 0.5 and 0.618 Fibonacci levels converge with the declining MA200. This region acted as a decisive rejection area during the 2022 fractal and is likely to play a similar role again.
What’s Next for ETH?
If Ethereum continues to defend the recent lows and holds above the $2,700–$2,800 support zone, the fractal suggests a relief bounce toward the $3,600–$3,880 resistance area could materialize. This zone represents the primary upside target for any corrective rally, supported by both historical price behavior and technical confluence.
However, it’s important to note that this setup currently points to a bounce, not a full trend reversal. A rejection from the $3,600–$3,880 region would keep the broader structure bearish and could open the door for renewed downside pressure, similar to what followed the 2022 fractal.
For now, Ethereum appears to be entering a stabilization phase after a prolonged decline. Whether this bounce evolves into something more meaningful will depend on how price reacts once it approaches major resistance. Until then, confirmation remains key, and caution is warranted as ETH navigates this critical zone.