On December 19, 2025, a key "Golden Cross" signal appeared on the technical chart of the US Dollar Index.
What makes this event particularly special is that this Golden Cross occurred against the backdrop of a weakening long-term trend line, marking the 16th occurrence of such a rare signal since 1970. Historical data shows that this type of technical pattern often signals a strengthening of the dollar in the following months and triggers a chain reaction in major assets such as US stocks and crude oil, providing important clues for the market landscape at the beginning of 2026.
I. The 39th Appearance of the "Golden Cross"
After the close on December 19, 2025, the US Dollar Index triggered a technical signal closely watched by the market: the 50-day moving average crossed above the 200-day moving average, forming a bullish pattern known as the "Golden Cross".
● Nature of the Signal: This signal is considered a medium-term trend reversal indicator in the market. The fundamental logic is that the short-term moving average crossing above the long-term moving average means that the recent average cost in the market is rising faster than the long-term cost, suggesting that buying power is gathering and the trend may shift from weak to strong.
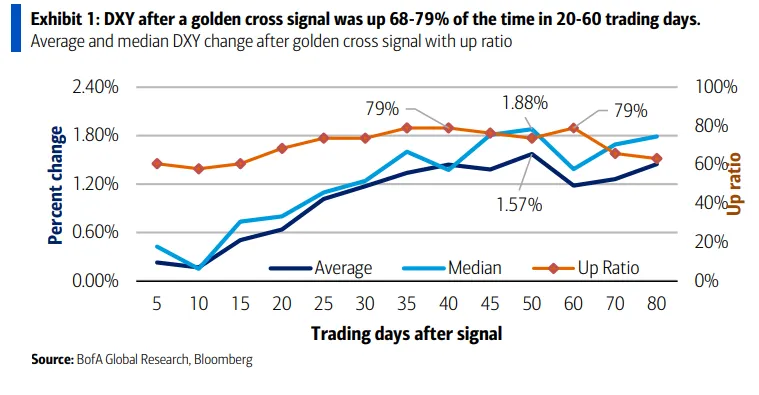
● Historical Statistical Significance: According to the technical strategy team at Bank of America Merrill Lynch, this is the 39th occurrence of the "Golden Cross" signal on the US Dollar Index since 1970.
Historical backtesting shows that the appearance of this signal is not a random noise. In the 20 to 60 trading days (about 1 to 3 months) after the signal appears, the probability of the US Dollar Index rising is between 68% and 79%. Among these, the probability of an increase is highest after 35-40 trading days and after 60 trading days, reaching 79%.
During this period, the average increase of the US Dollar Index is about 1.22%, with the median increase even higher at about 1.40%. This statistical pattern provides historical evidence for a possible technical rebound of the dollar in the first quarter of 2026, even though there are usually seasonal weakness factors at the end of the year.
II. "Weak Golden Cross" in a Downtrend
The reason why this "Golden Cross" has attracted particular attention from the market is not only because of the signal itself, but also because of the special market environment in which it occurred.
● Rare Technical Background: When this Golden Cross occurred, not only did the short-term moving average cross above, but more importantly, the 200-day moving average itself was also in a downward trend. This is defined as a "very rare type"—this is the 16th time since 1970 that a Golden Cross has occurred while the 200-day moving average is declining.
● Stronger Historical Implications: In this special context, the historical performance is even stronger than that of ordinary Golden Cross signals. Data shows that when a Golden Cross occurs simultaneously with a declining 200-day moving average, the probability of the US Dollar Index rising after 15, 25, 35, and 60 trading days is as high as 80% (i.e., 12 out of 15 times in history saw an increase).
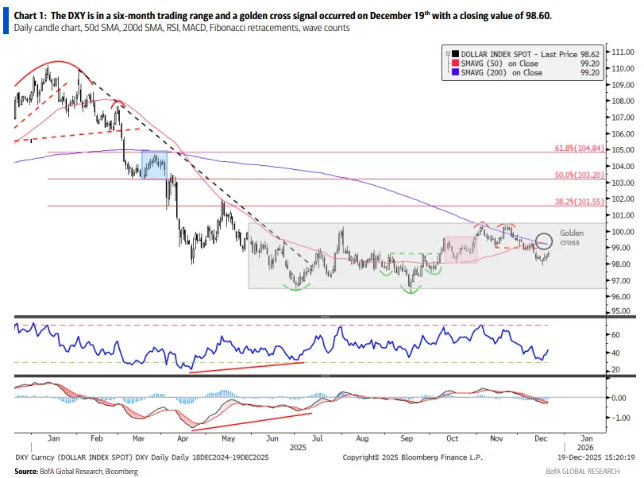
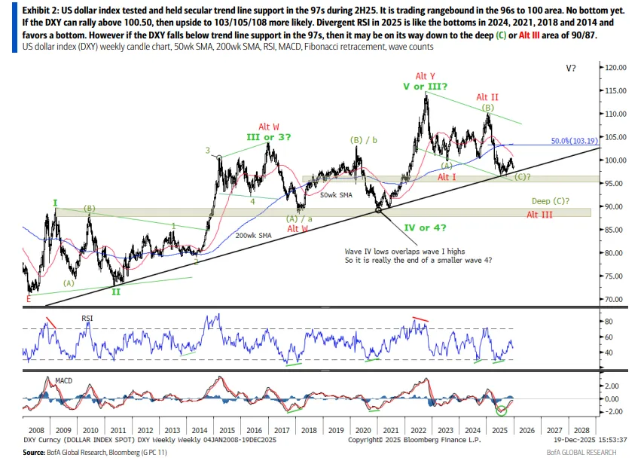
● Historical Reference and Risks: The last time a similar double moving average downtrend Golden Cross occurred was in 2004. At that time, the US Dollar Index experienced about half a year of sideways consolidation, with significantly increased market volatility, and both Golden Cross and the opposite "Death Cross" appeared in quick succession. This suggests to investors that although the current signal indicates a high probability of an increase, it does not necessarily mean a one-sided smooth upward trend, and the possibility of market volatility also exists. Analysis also points out that the US Dollar Index is currently testing the key long-term trend line support in the 97 area; if it breaks below, it may open up further downside space to the 90/87 area.
III. Chain Reactions on US Stocks, Crude Oil, and Other Assets
As the pricing anchor for global assets, potential changes in the technical trend of the US dollar often have spillover effects, influencing the performance of other major asset classes. Historical data reveals the following correlations:

From the table above, we can see:
● Crude oil is the most responsive asset, especially after this special type of Golden Cross, with a historical probability of increase at 100%, showing a very strong positive correlation.
● US stocks show a lagged response: The S&P 500 Index does not follow immediately, but tends to strengthen more than a month later, which may reflect the market's digestion process of the initial impact of a stronger dollar.
● Differentiation among safe-haven assets: Gold and US Treasury yields have not shown a clear direction, suggesting that under expectations of a stronger technical outlook for the dollar, traditional safe-haven assets may face a complex long-short tug-of-war.
IV. The Interplay of Technical Signals and Macroeconomic Reality
Although historical technical patterns have issued bullish signals, the current fundamental environment facing the dollar is complex, and there are divergent views among market institutions. Investors need to take a comprehensive approach.
● Technical Support Viewpoints: In addition to Bank of America Merrill Lynch, other institutions have also noted the positive technical changes in the dollar. DBS Bank pointed out in its December 2025 report that the US Dollar Index has formed a sideways consolidation between 96.50 and 100.30 since June 2025, which may be an "extended bottom," and believes that the dollar's technical outlook has turned bullish. They noted that if the US Dollar Index can break through the key resistance at 100.26, it may further test the 101.55-101.98 area.
● Macroeconomic Constraints: At the same time, many macro analyses point out that the dollar faces structural pressures. Goldman Sachs stated in its mid-2025 report that due to three major headwinds—US policy uncertainty, the trend of global capital diversification, and fiscal concerns—the dollar's "safe-haven attribute" has significantly weakened, and it now behaves more as a "risk currency," with its weakening cycle possibly continuing. UBS also predicts that in the fourth quarter of 2025, due to expectations of US interest rate cuts and a weakening labor market, the dollar will continue its weak trend.
● A Rational View of Technical Signals: Market experience reminds us that no technical indicator is a "foolproof holy grail." Moving averages are essentially lagging indicators, and Golden Cross signals often confirm trends that have already occurred, rather than providing precise forward-looking predictions. Investors should avoid blindly following a single signal and instead make judgments based on a broader fundamental context.
V. The Game at a Critical Window
In summary, the rare "Golden Cross" that appeared on the US Dollar Index at the end of 2025 has undoubtedly injected a new variable into the market.
● Core Insights of the Signal: The core value of this signal is that it suggests, from a probabilistic advantage, that the likelihood of a technical rebound in the dollar is increasing in the first quarter of 2026 (the next 20-60 trading days), especially considering that this Golden Cross belongs to the historically higher-probability "weak background" type.
● The Interplay of Bullish and Bearish Factors: However, the ultimate direction of the dollar will be the result of a tug-of-war between technical and fundamental forces. The technical momentum for a rebound will directly compete with fundamental factors such as the Federal Reserve's policy path (timing and extent of rate cuts), the growth differential between the US and non-US economies, and global geopolitical risks.
● Implications for Investors: For market participants, the more important significance of this signal is that it points to the potential rotation direction of asset allocation. Historical patterns show that if the dollar strengthens as the probabilities suggest, crude oil and the lagging US stocks may become correlated assets worth watching. At the same time, investors should closely monitor the US Dollar Index's breakthrough of the key support near 97 and key resistance near 100.26, as these will be important observation points for judging whether the technical rebound can unfold smoothly.