Institutional demand for Bitcoin and Ethereum is showing clear signs of fatigue, with new data from Glassnode and SoSoValue indicating that ETF inflows have remained negative for more than six weeks.
The trend reflects a broader liquidity contraction across crypto markets, as risk appetite falls and allocators take a more cautious stance heading into year-end.
ETF flows turn negative across BTC and ETH
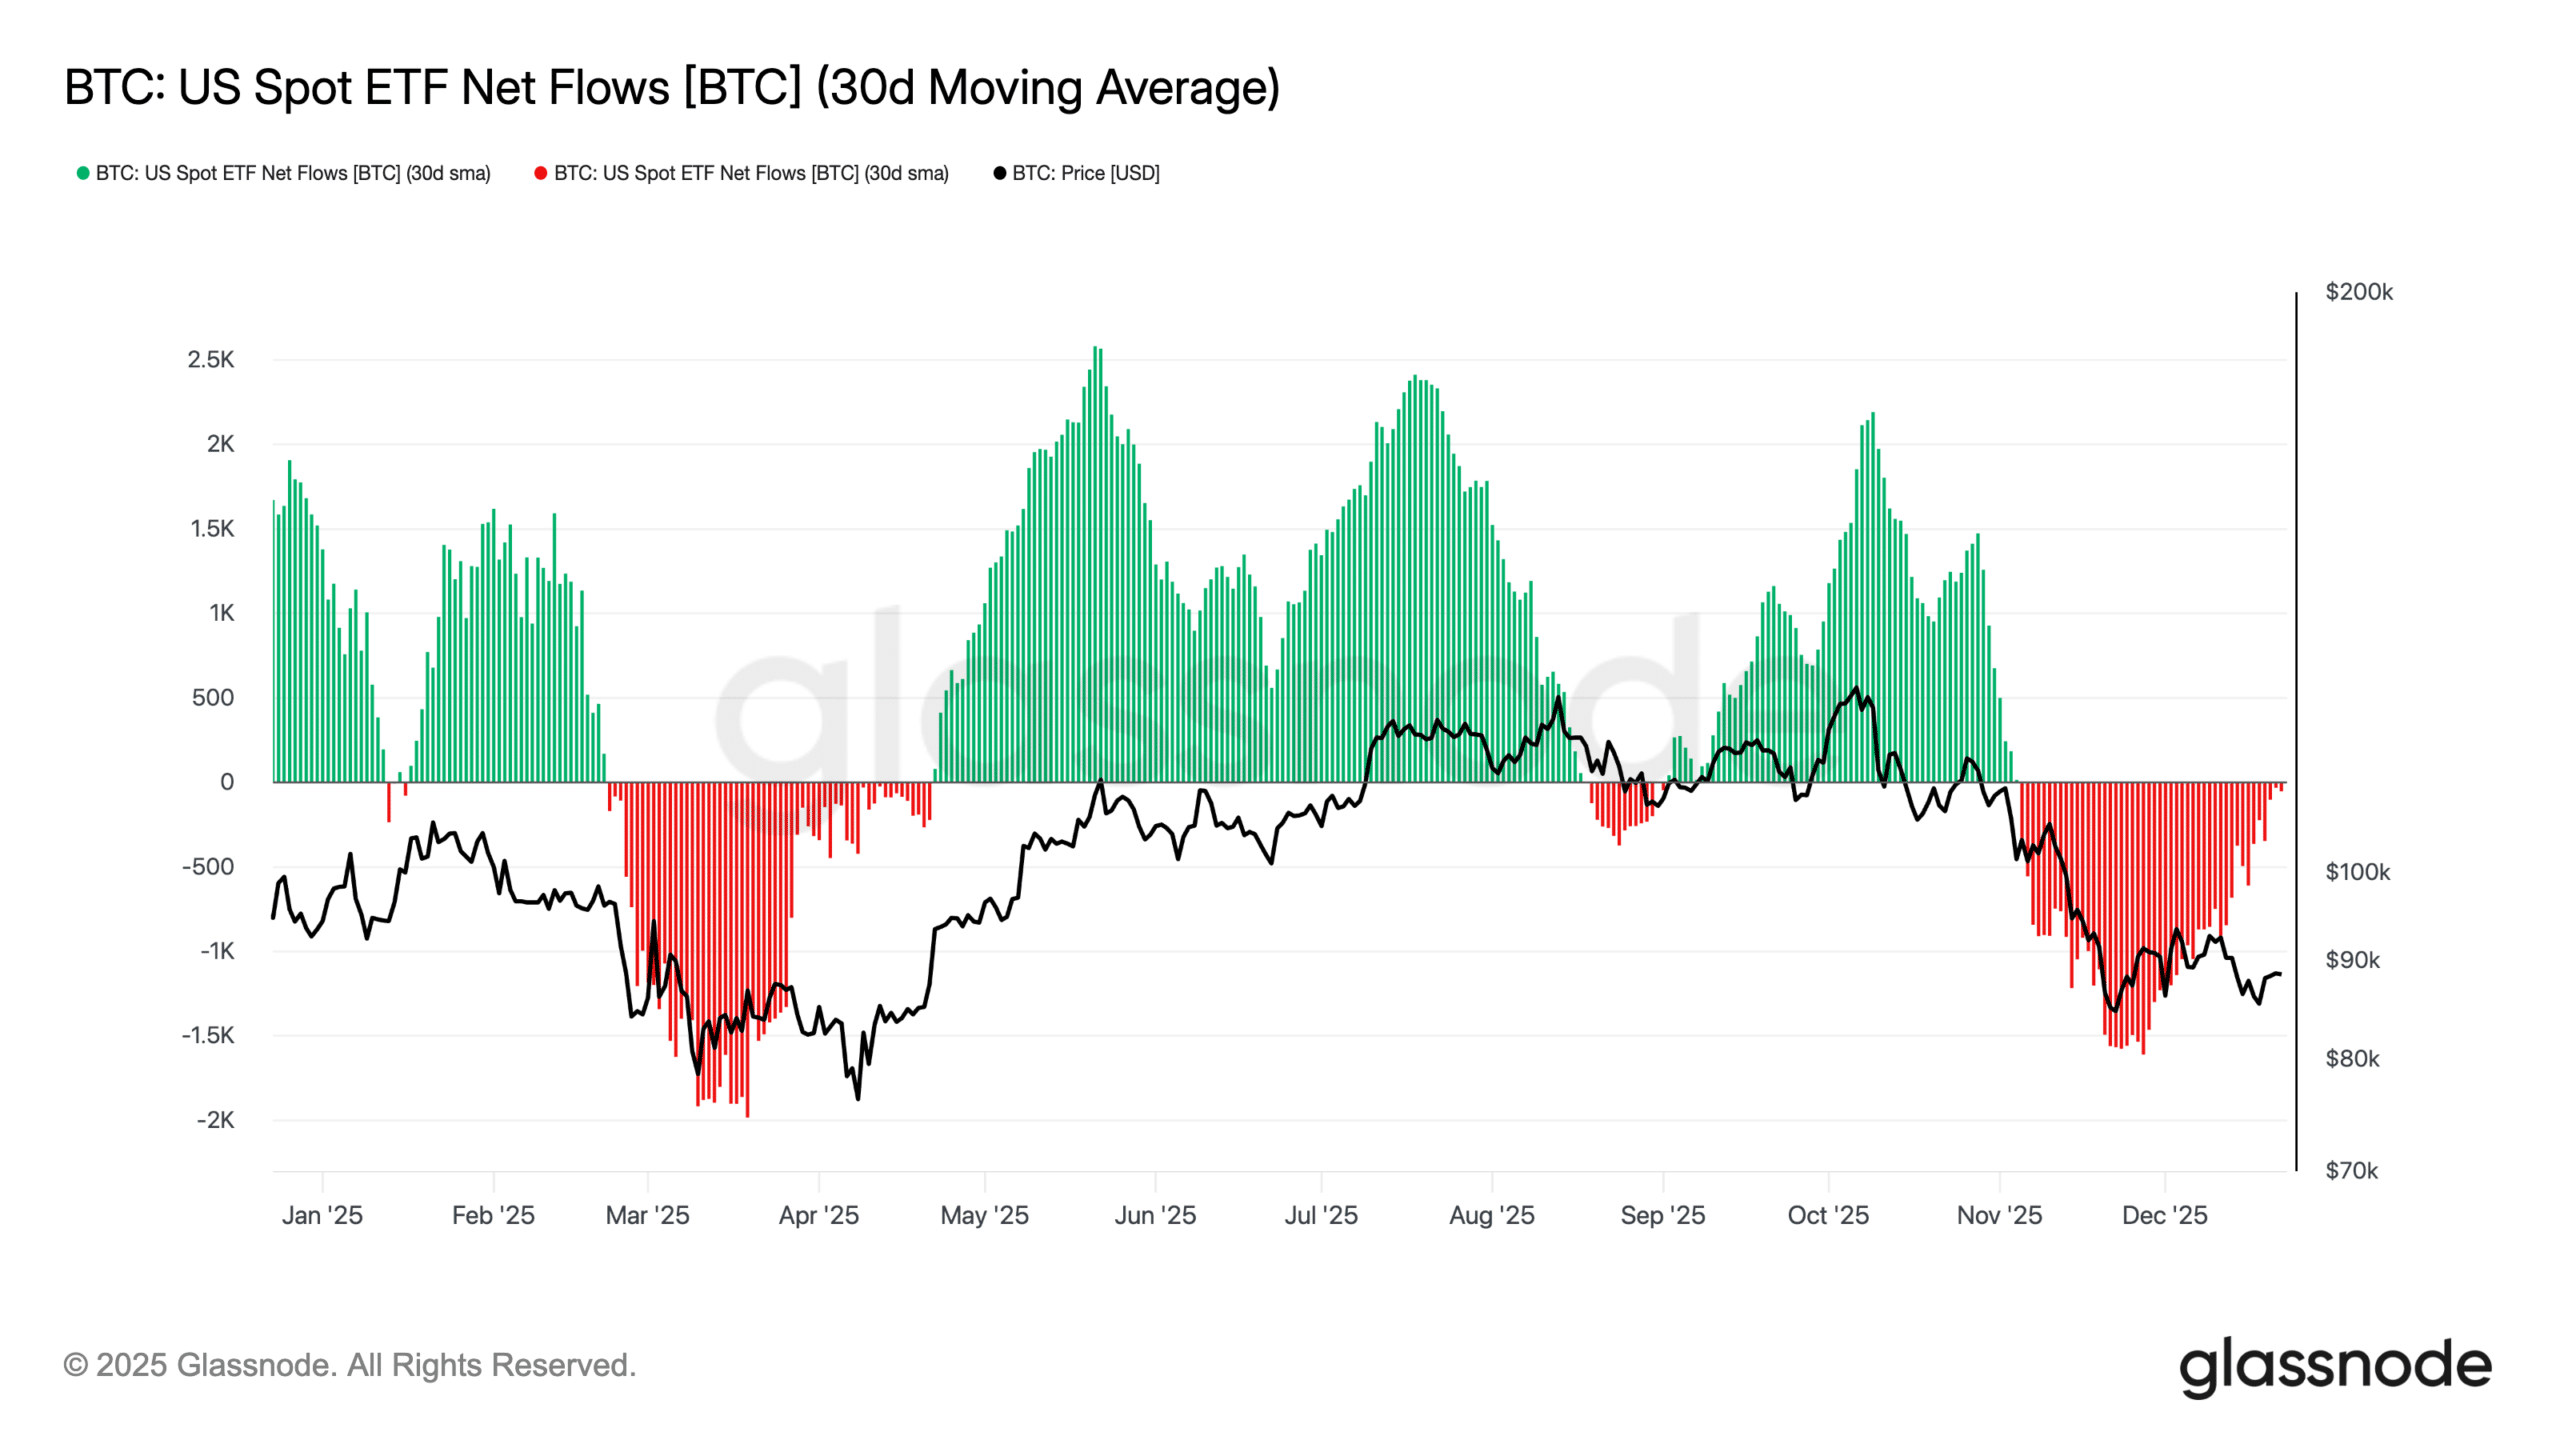
Glassnode’s latest readings show that the 30-day moving average of net flows for both Bitcoin and Ethereum ETFs flipped negative in early November and has not recovered since.
For most of 2025, ETF activity served as a major source of liquidity—particularly during the July–September window when inflows surged and helped push BTC above $110k and ETH above $4,500.
But since November, the momentum has reversed sharply. Daily flows have been dominated by steady red bars, indicating sustained outflows and reduced participation from larger allocators.
Bitcoin ETFs face some of the heaviest outflows
Daily data from SoSoValue shows that Bitcoin ETF products recorded a net outflow of– $142.19 million today, extending a pattern of withdrawals seen throughout November and December.
Source: Glassnode
The total net assets of BTC ETFs have also dropped to $114.99 billion, down significantly from their summer peak.
The decline mirrors the fall in spot prices, with Bitcoin now trading around $88,351, unable to reclaim the $90k level despite multiple attempts.
The last meaningful wave of inflows occurred in mid-October, but since then, outflows have overwhelmed intermittent green spikes.
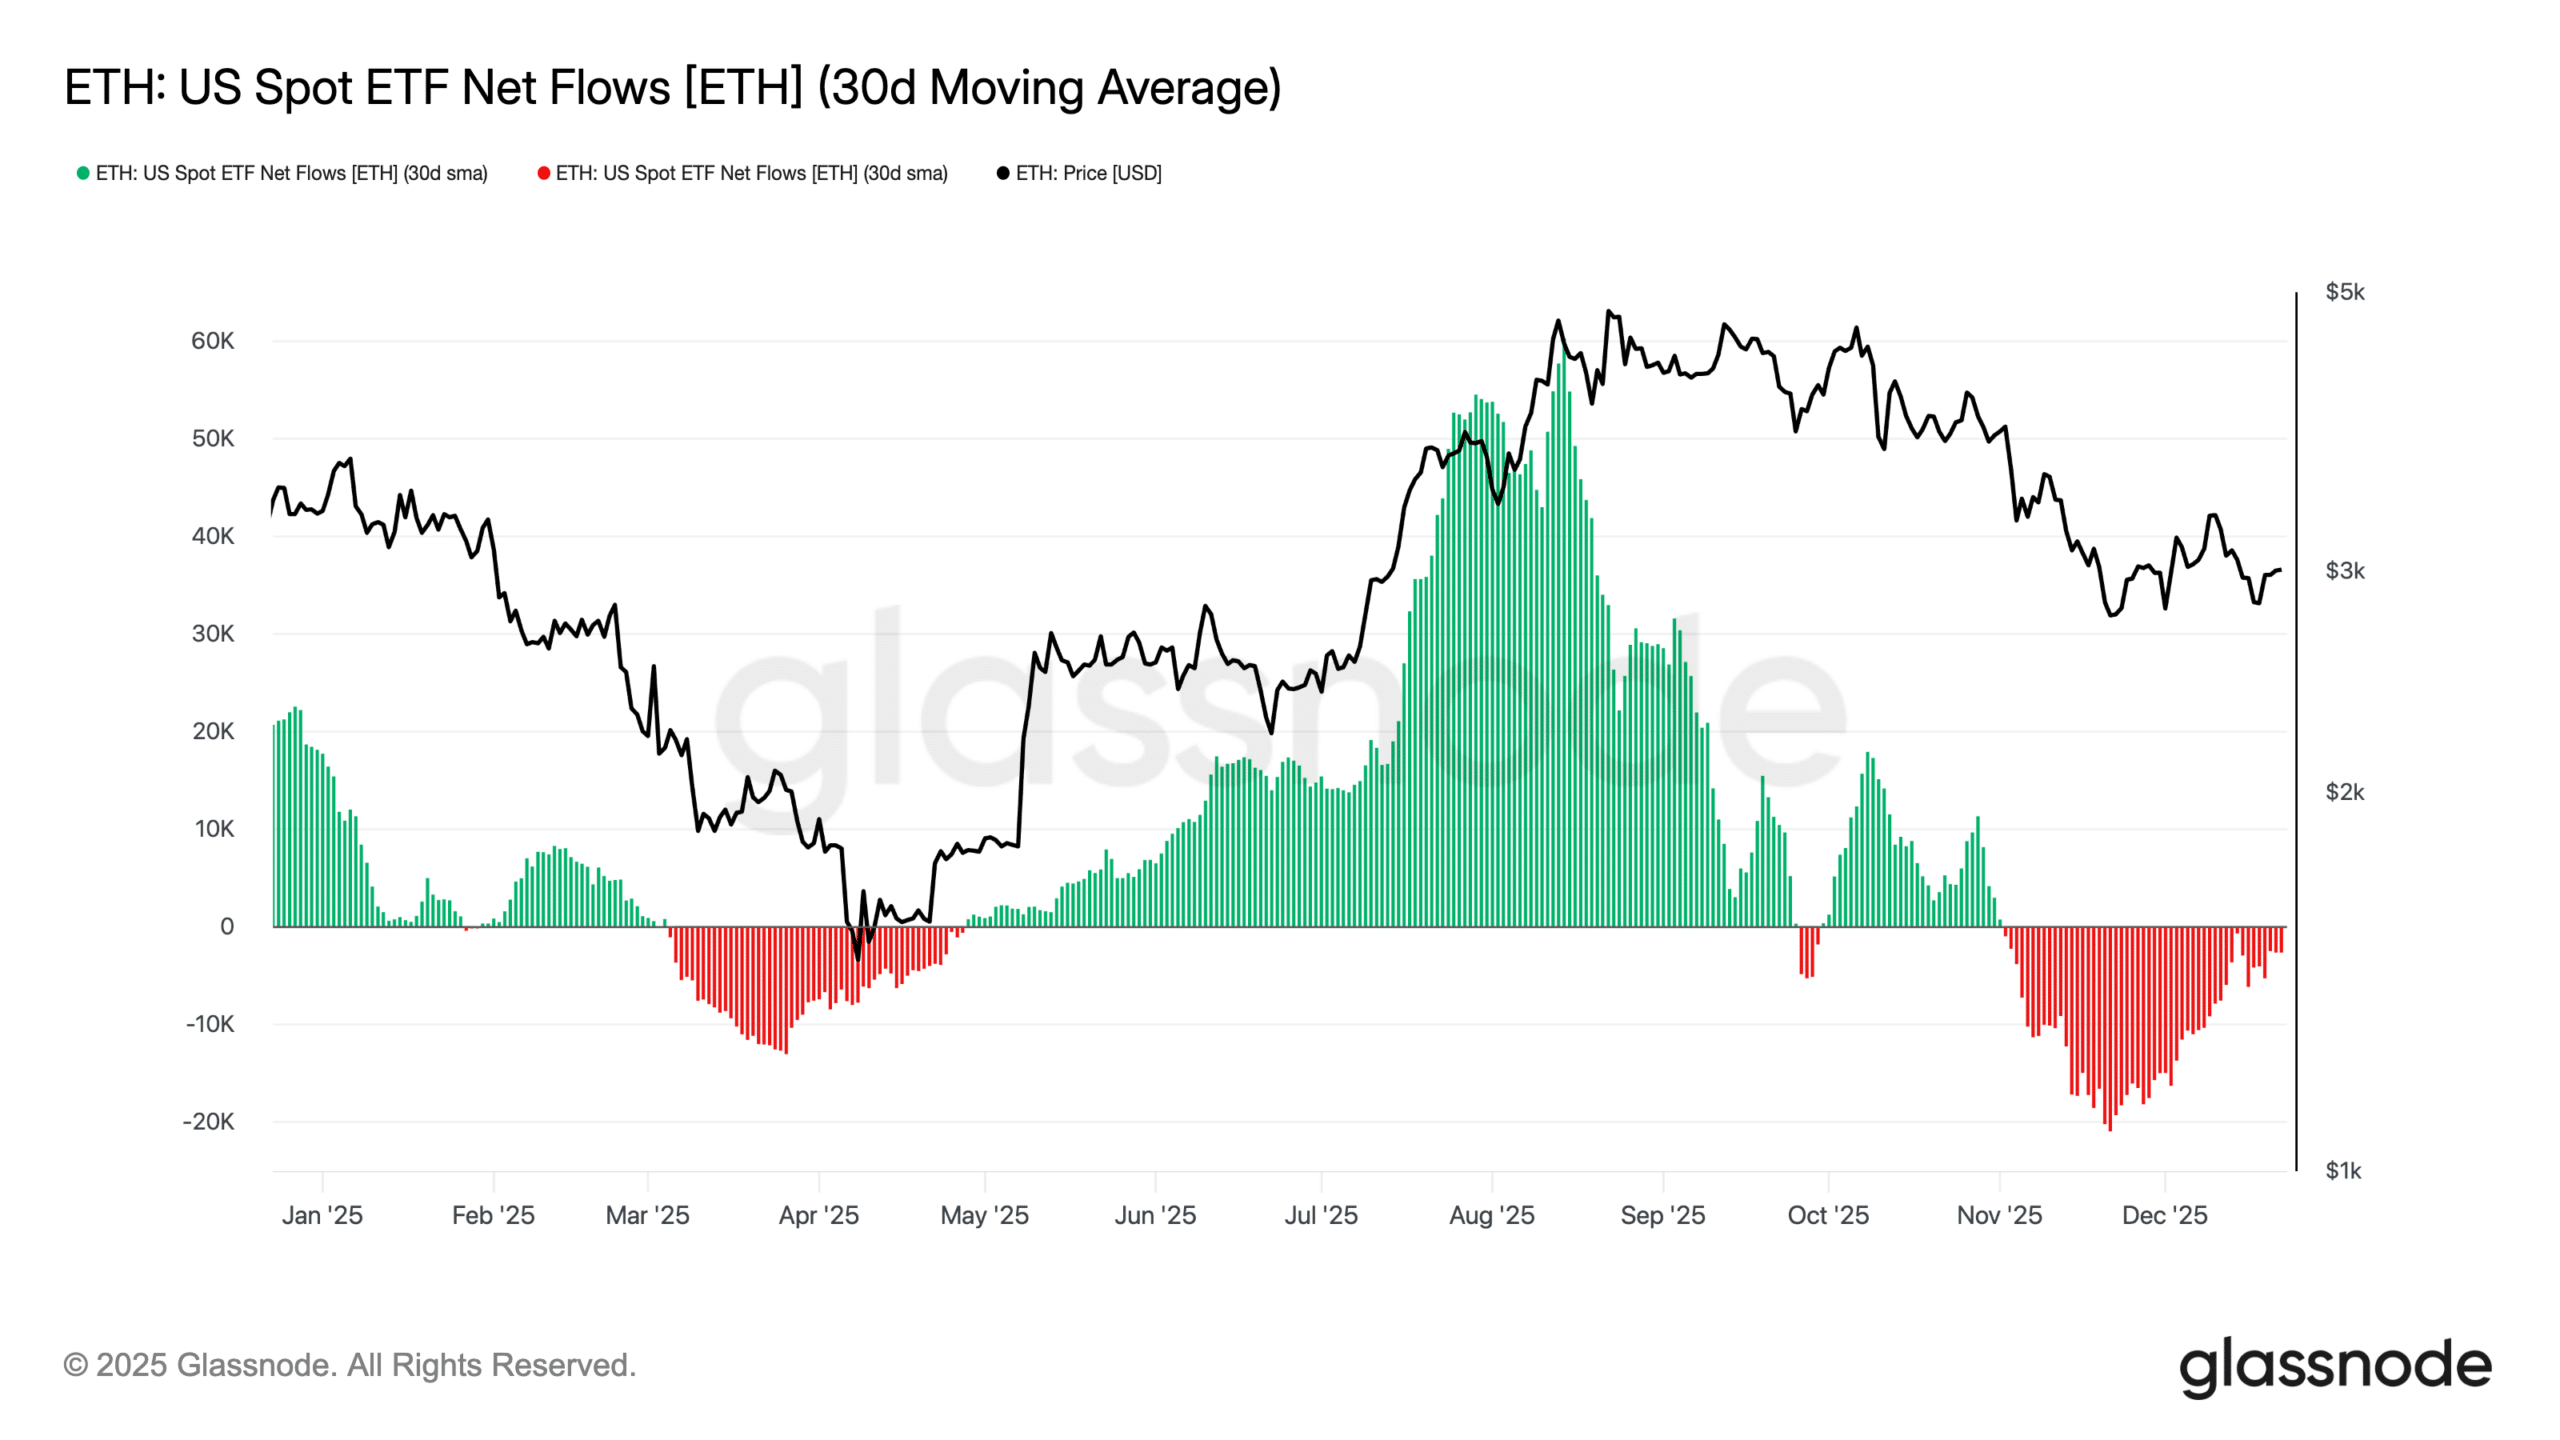
Ethereum ETFs show mixed short-term flows but a weakening trend
Ethereum ETFs saw $84.59 million in inflows today, but that single data point sits against a much broader backdrop of outflows.
Source: Glassnode
The 30-day SMA for ETH ETF flows is still firmly negative, confirming that recent buying has not been strong enough to reverse the wider trend.
The AUM of the ETH ETF stands at $18.20 billion, down from the high reached during the surge of inflows in August.
ETH’s price, now around $2,976, continues to drift lower as ETF demand softens and liquidity thins.
Liquidity contraction and year-end de-risking
On-chain and ETF metrics are aligning to show a consistent pattern:
- Allocators have reduced exposure.
- Risk appetite remains muted.
- Summer’s strong inflow cycle has fully unwound.
Much of this cooling can be attributed to year-end rebalancing by funds, weaker macroeconomic liquidity, and the fading post-ETF approval euphoria that drove inflows earlier in the year.
The current environment resembles previous phases where institutional investors stepped back temporarily before repositioning once volatility stabilised.
What this means for BTC and ETH now
Both assets remain highly sensitive to ETF flows. With sustained outflows and shrinking AUM across both sets of products:
- Upside momentum remains limited
- Prices may trade sideways until demand returns
- Any future positive catalyst, macro or regulatory, could spark renewed inflows
For now, the data signals a cooling period rather than structural rejection.
However, with ETF flows acting as crypto’s dominant liquidity driver in 2025, a shift back into positive territory will be essential for any strong recovery in early 2026.
Final Thoughts
- ETF outflows suggest that institutions are de-risking rather than abandoning the market, indicating a temporary liquidity contraction.
- A sustained return of positive flows may be required before BTC and ETH can regain strong upward momentum.