
XRP Price Turns Lower as a Familiar Pattern Reappears Again

XRP price failed to gain pace above $1.920 and trimmed gains. The price is now struggling and faces resistance near the $1.820 level.
- XRP price started a fresh decline below the $1.850 zone.
- The price is now trading below $1.850 and the 100-hourly Simple Moving Average.
- There is a bearish trend line forming with resistance at $1.920 on the hourly chart of the XRP/USD pair (data source from Kraken).
- The pair could continue to move down if it settles below $1.780.
XRP Price Dips To New Weekly Lows
XRP price attempted a recovery wave above $1.90 but failed to continue higher, like Bitcoin and Ethereum. The price started a fresh decline below $1.880 and $1.850.
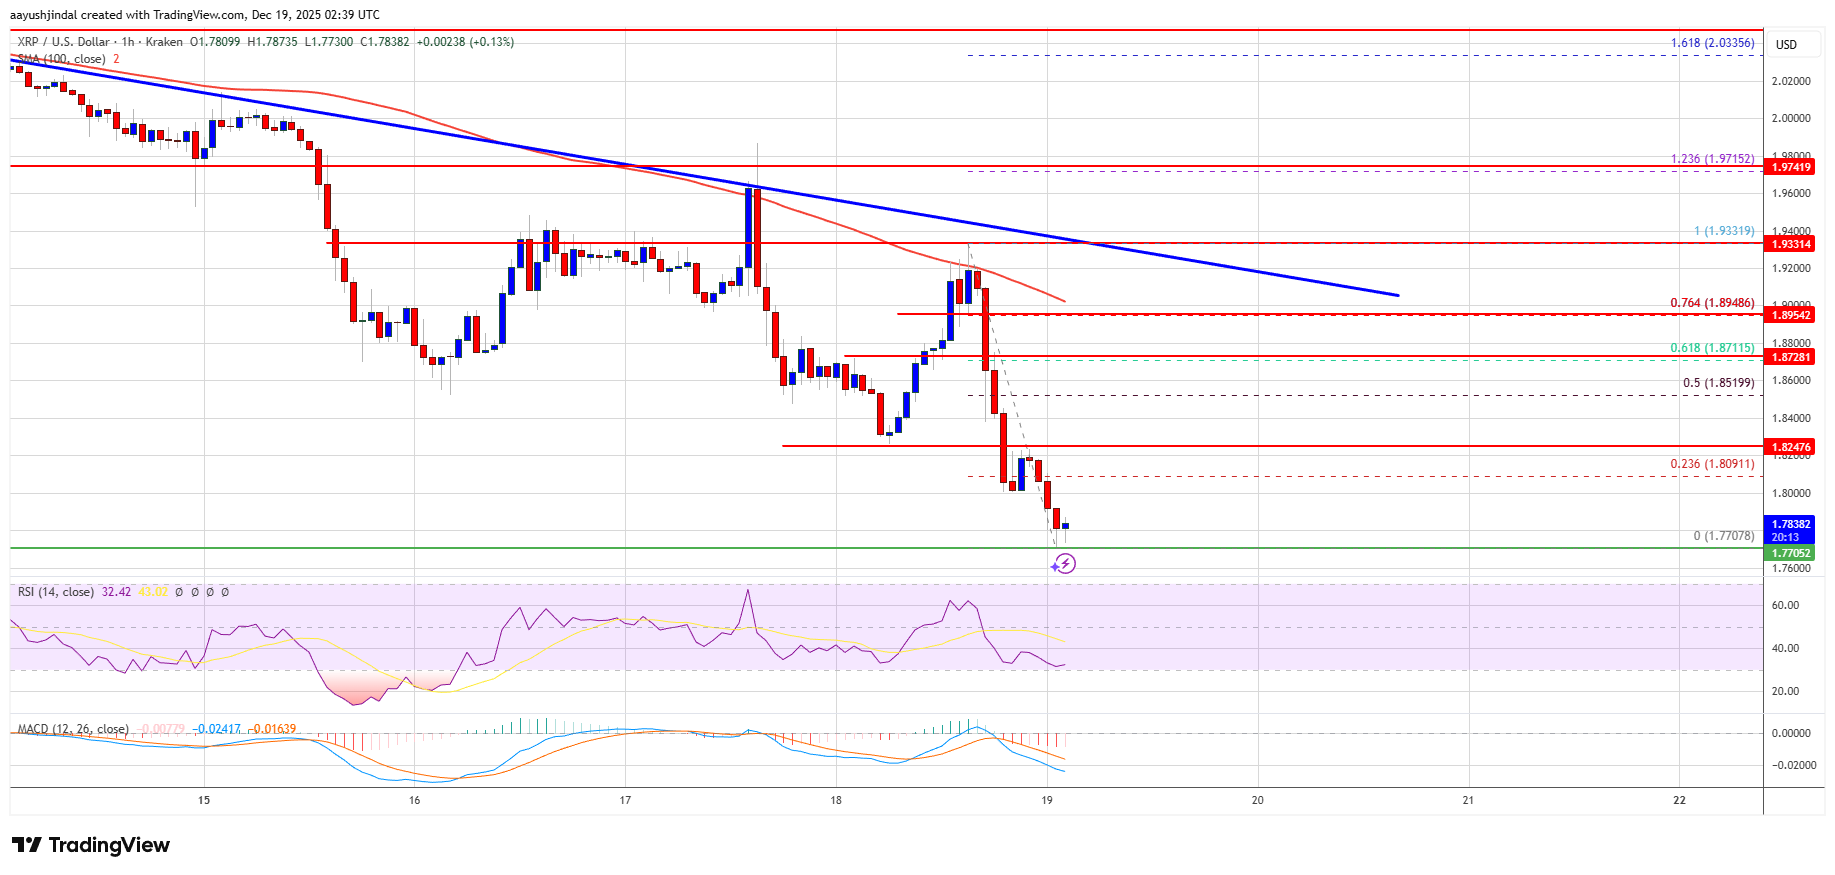
There was a move below the $1.820 support level. A low was formed at $1.7707, and the price is now showing bearish signs below the 23.6% Fib retracement level of the downward move from the $1.9331 swing high to the $1.7707 low.
The price is now trading below $1.850 and the 100-hourly Simple Moving Average. There is also a bearish trend line forming with resistance at $1.920 on the hourly chart of the XRP/USD pair.
If there is a fresh upward move, the price might face resistance near the $1.810 level. The first major resistance is near the $1.8520 level or the 50% Fib retracement level of the downward move from the $1.9331 swing high to the $1.7707 low. A close above $1.8520 could send the price to $1.880.
 Source:
XRPUSD on TradingView.com
Source:
XRPUSD on TradingView.com
The next hurdle sits at $1.920 and the trend line. A clear move above the $1.920 resistance might send the price toward the $1.9650 resistance. Any more gains might send the price toward the $2.00 resistance. The next major hurdle for the bulls might be near $2.050.
More Losses?
If XRP fails to clear the $1.8520 resistance zone, it could start a fresh decline. Initial support on the downside is near the $1.780 level. The next major support is near the $1.7620 level.
If there is a downside break and a close below the $1.7620 level, the price might continue to decline toward $1.720. The next major support sits near the $1.70 zone, below which the price could continue lower toward $1.680.
Technical Indicators
Hourly MACD – The MACD for XRP/USD is now gaining pace in the bearish zone.
Hourly RSI (Relative Strength Index) – The RSI for XRP/USD is now below the 50 level.
Major Support Levels – $1.780 and $1.7620.
Major Resistance Levels – $1.8520 and $1.920.
Disclaimer: The content of this article solely reflects the author's opinion and does not represent the platform in any capacity. This article is not intended to serve as a reference for making investment decisions.
You may also like
Is Toncoin Undervalued? December Data Signals Potential Rebound
XRP Selling Pressure Collapses 39%, But This Price Level Still Controls the Outcome
Shocking Attempt to Buy Tether with $290K in Fake Cash Exposed
Burry warns household stock boom echoes 1960s–1990s bear market pivots