
Date: Thu, Dec 18, 2025 | 06:20 AM GMT
The broader cryptocurrency market has seen choppy and uncertain price action over the past several weeks, following a sharp sell-off that began on October 10. That correction pushed Ethereum (ETH) down nearly 22% over the past 60 days, keeping pressure firmly on major altcoins.
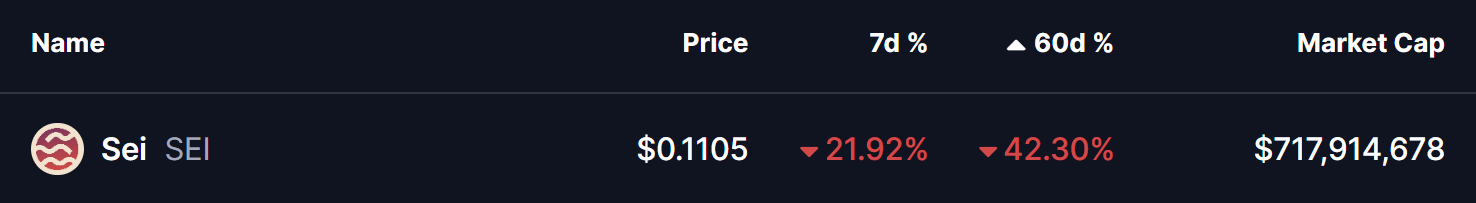
Among them, Sei (SEI) has been particularly weak, sliding more than 21% in just the past week and extending its 60-day decline to over 42%. Notably, the latest technical structure indicates that SEI may be setting up for a deeper downside move in the near term.
 Source: Coinmarketcap
Fractal Setup Hints at Further Downside
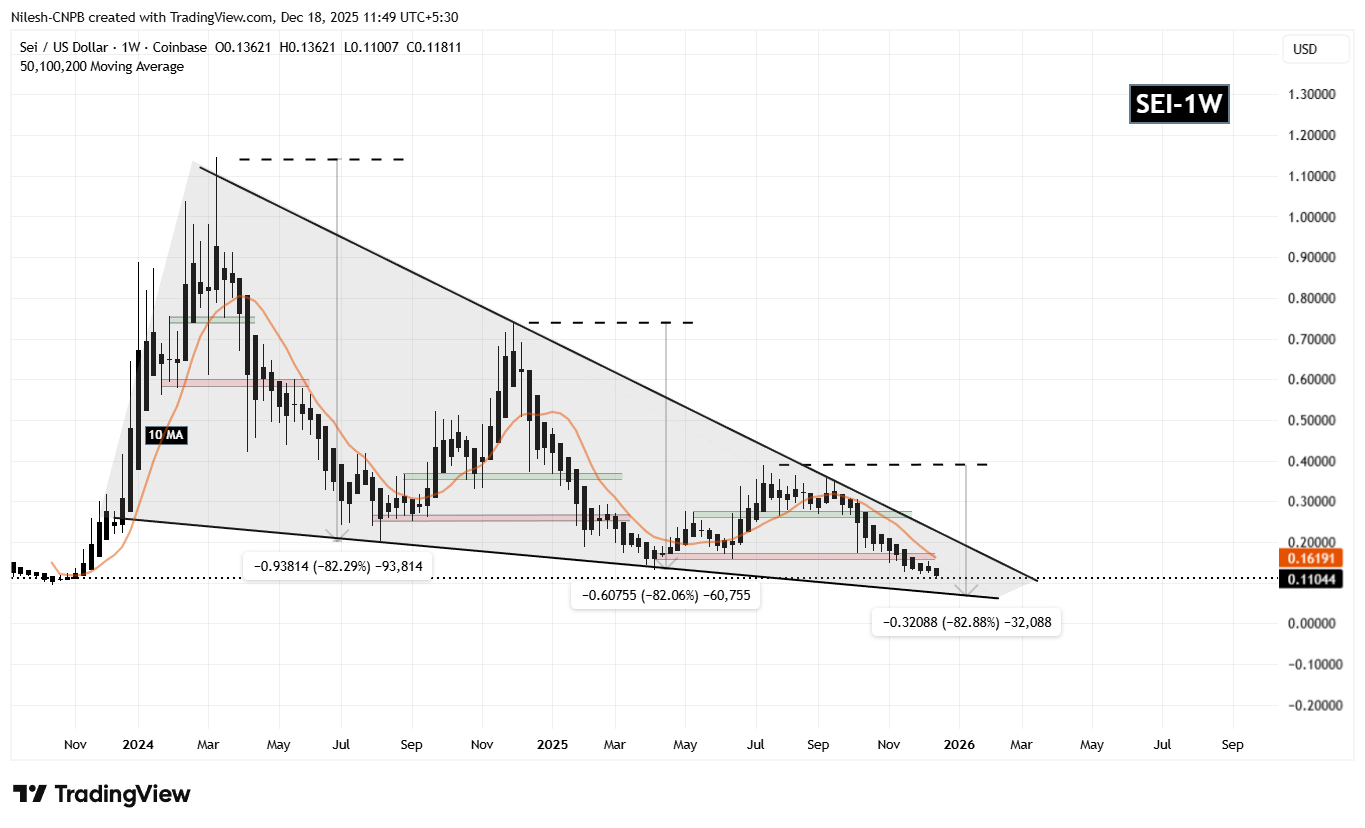
On the weekly timeframe, SEI continues to trade within a large falling wedge that has defined its trend since early 2024. Historically, this structure has acted as a distribution zone, with price repeatedly rallying toward the upper resistance trendline before facing strong rejection.
What makes the current setup particularly concerning is the repeating fractal pattern visible on the chart. In April 2024 and again in February 2025, SEI was rejected from the wedge’s upper boundary, lost key horizontal support zones, and went on to record steep corrections of roughly 82%. In both cases, price eventually gravitated back toward the lower boundary of the wedge before attempting a short-lived recovery.
 Sei (SEI) Weekly Chart/Coinsprobe (Source: Tradingview)
The chart now shows SEI following the same path once again.
After its previous rejection near the $0.3576 region, SEI slipped below multiple support areas marked on the chart. Price is now hovering around the $0.11 zone — a level that closely aligns with where previous deep corrections paused before another leg lower or consolidation.
With the fractal lining up almost point-for-point, the technical picture suggests that bearish momentum may still be in control.
What’s Next for SEI?
As long as SEI remains below the former support and fails to regain the red-zone level near $0.1582, the downside fractal remains valid. If history repeats, the pattern implies the possibility of another extended decline toward the lower boundary of the falling wedge, which currently sits around the $0.07 area. From current levels, that would translate into an additional downside move of roughly 35–40%.
That said, there is a clear invalidation point to watch. A strong rebound that allows SEI to reclaim the 10-week moving average near $0.1619 could disrupt the fractal structure and hint that selling pressure is finally easing. Such a move would be an early signal that the market is attempting to form a more durable base.
For now, however, the weekly chart suggests that SEI remains technically vulnerable. Until key resistance levels are reclaimed, the path of least resistance appears tilted to the downside, with traders closely watching whether this familiar fractal plays out once again.