Crypto Market Review: Shiba Inu (SHIB) at Critical Reversal Level, Ethereum (ETH) Bullishness to Explode Again, XRP's Last Hit Point Before Losing $2

The chart painfully demonstrates that Shiba Inu is in a make-or-break situation. SHIB has narrowed into a structure slightly above the local lows, following months of consistent downward pressure. The price has not yet recovered anything significant, but it is no longer falling freely. This is the kind of place where trends either reverse or persist steadily.
Technically speaking, SHIB is still below all of the major moving averages. The 200-day moving average overhead is still acting as a ceiling, and the long-term trend is still negative. Over the past few months, every attempt at a rally has been thwarted at lower highs, demonstrating that sellers continue to dominate the larger structure.
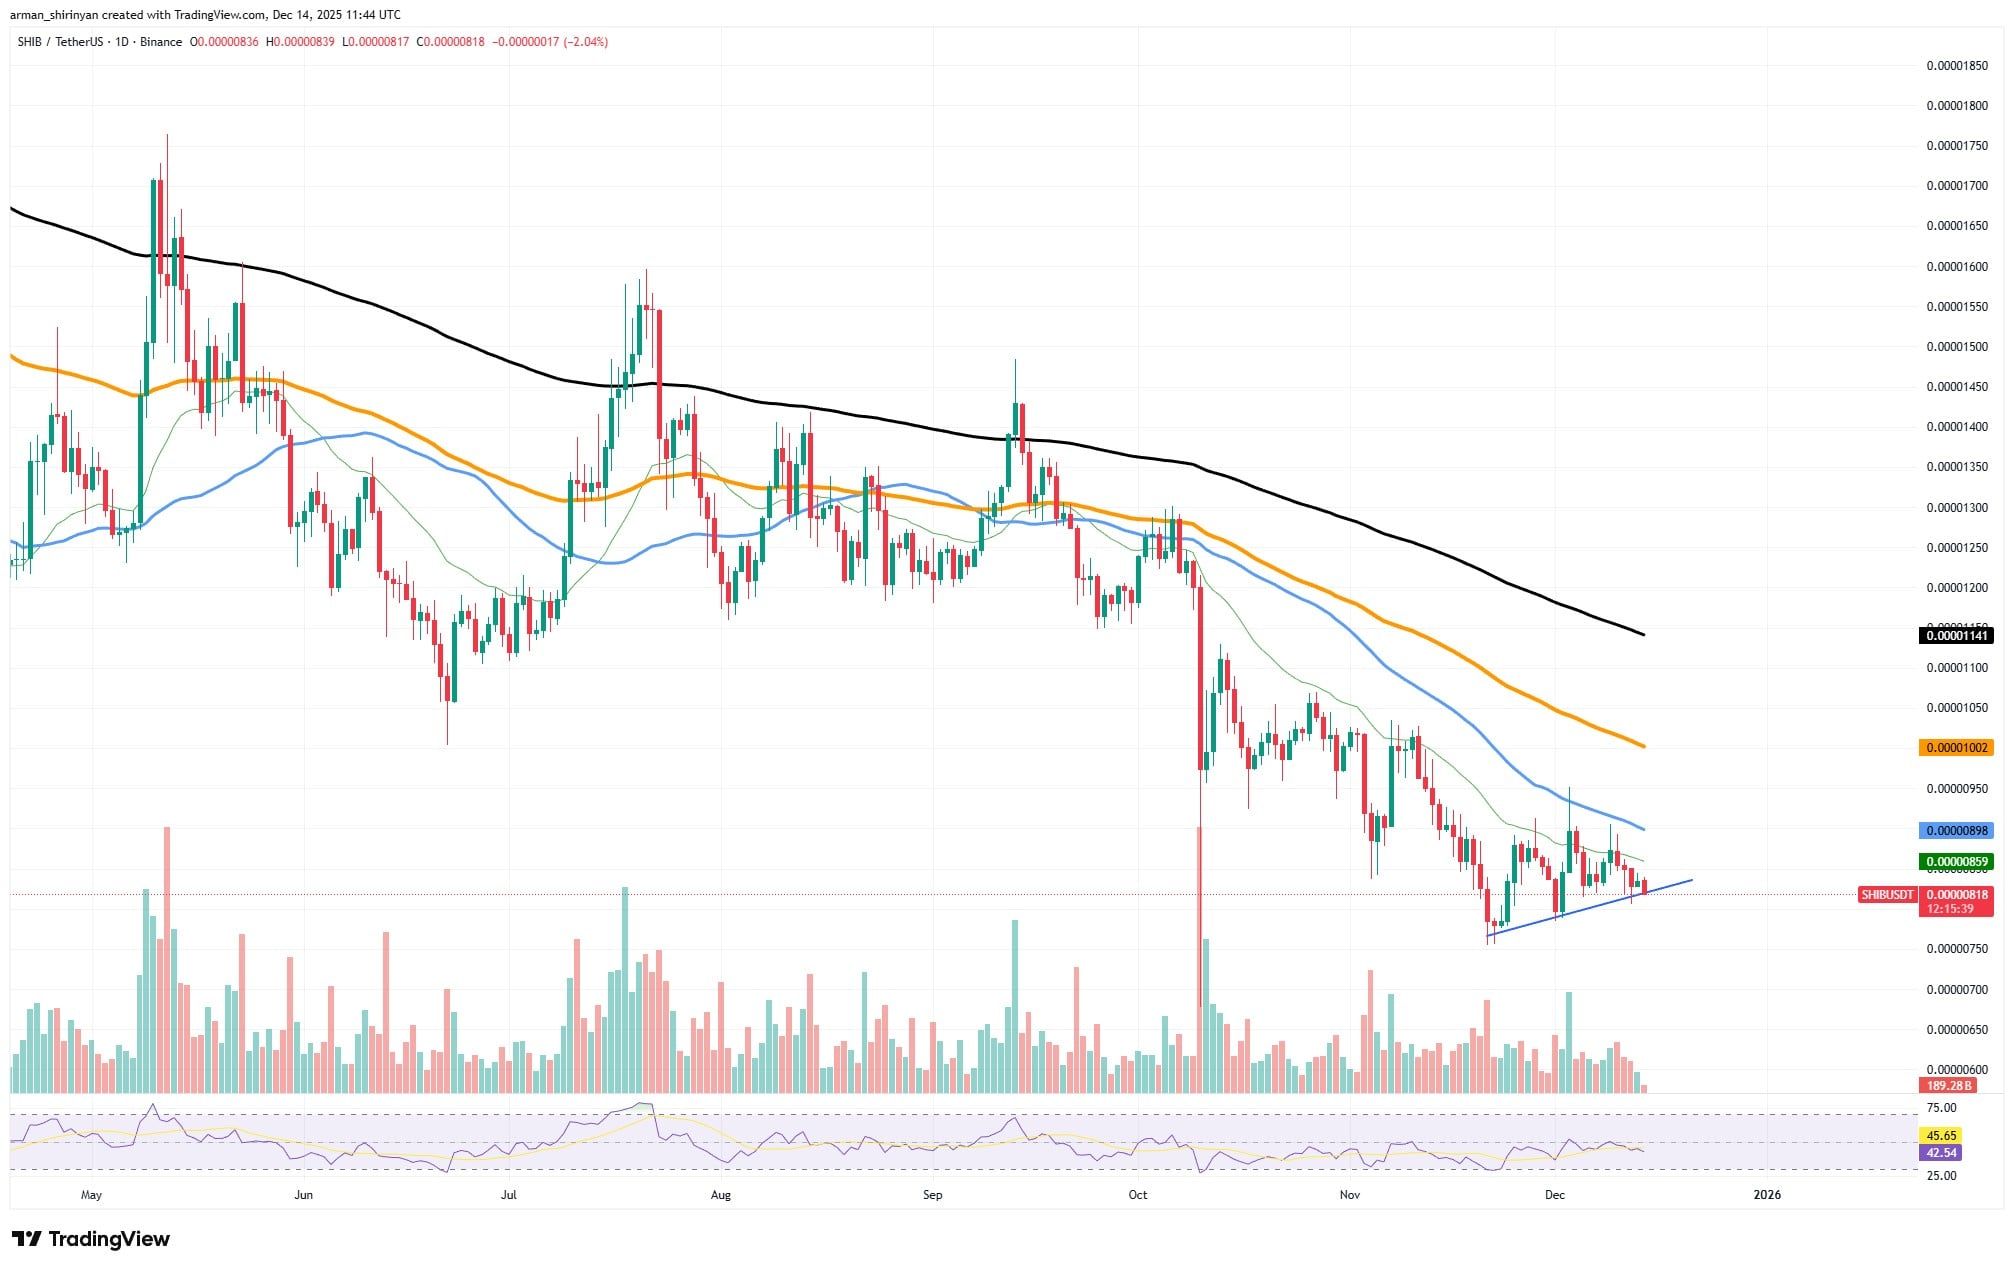
Nevertheless, sales have significantly slowed down. The short-term ascending support that is currently forming beneath the price is the most crucial detail. In opposition to horizontal resistance, SHIB has been printing somewhat higher lows, forming a tiny rising wedge. The RSI is hovering in neutral territory, which typically indicates indecision rather than surrender, and the volume has dried up. This is traditional compression behavior prior to expansion.
The first scenario is a bullish reversal. The next move would probably target the closest moving averages if SHIB maintains the current support and successfully breaks above the wedge resistance. A wider relief rally would be possible if the short-term averages were regained, which would change momentum in favor of buyers. This would confirm that accumulation is occurring at these levels, but it would not imply the end of the long-term bear trend.
The bearish continuation is the second scenario. SHIB loses its final visible structural defense if the rising support fails. Stop-losses and renewed seller confidence would probably cause another leg down. In that scenario, any bullish narrative would be delayed until a more distinct base forms, and price would be compelled to look for deeper demand.
Ethereum stays cautious
A more significant move is imminent because Ethereum is in an uncomfortable position for both sides of the market. ETH has stopped bleeding and begun compressing just below key resistance, following a severe rejection from the highs and a deep corrective leg. Although it is still not strength, it is also no longer weakness. There is increasing pressure.
The medium-term trend is technically bearish, since Ethereum is still below its major moving averages from a structural perspective. Every bounce into the 100- and 200-day averages overhead has been aggressively sold, and they continue to function as dynamic resistance. This is the primary reason why many traders perceive ETH as stuck. However, markets coil rather than stagnate.
The crucial shift is momentum. Compared to earlier relief moves, the recent bounce off the local lows was impulsive, and selling pressure has obviously decreased. Volume decreased during pullbacks and increased during rebounds, indicating that distribution is no longer in control. RSI is grinding higher from neutral territory, it is not washed out or overheated, which is a common configuration prior to directional expansion.
The wider resistance band close to the long-term averages would be the next test if Ethereum is able to recover the short-term moving averages and maintain above them. This level is important. A successful break and hold would likely cause sidelined capital to reenter the market and return it to a bullish alignment. This is typically the beginning of explosive moves, which come from disbelief rather than euphoria.
There is little risk involved. The market's continued lack of conviction will be confirmed if ETH fails to maintain its current support and rolls over once more. This would postpone any further upward movement and keep the price confined to a larger consolidation range. Crucially though, that result merely extends the timeline and does not refute the larger bullish thesis.
XRP running on empty
The chart painfully illustrates that XRP is running out of space. The price is hovering just above the psychologically significant $2 level, while pressing against the lower boundary of a descending channel. This is compression under ongoing selling pressure, not a healthy consolidation. The decline could pick up speed quickly if this level collapses.
Technically speaking, XRP is trapped in a distinct decline. Every bounce below important moving averages has failed, and lower highs have been respected for weeks. The long-term trend line above price functions as a ceiling rather than support, while the short-term averages keep sloping downward. Momentum is clearly bearish based only on that structure. Customers are not taking the initiative, rather they are responding.
Due to its multitasking, the $2 zone is significant. It is the lower edge of the current channel, a local horizontal support and a round-number psychological level. Cluster stops when levels like that break. The liquidity vanishes. At that point, the price drops rather than drifting lower. With very little structure in between to slow it down, a clean breakdown below $2 would probably cause a swift move into the next demand pocket.
The bull case is not being helped by volume behavior either. Distribution rather than accumulation is suggested by the fact that selling spikes has been more profitable than purchasing them. RSI is in weak territory and is not producing any significant bullish divergence. To put it another way, momentum is a warning of continuation rather than a reversal.
It is theoretically possible for XRP to bounce here. However, a bounce that does not restore broken resistance would only result in another lower high, which would present a selling opportunity for those who are stuck above. XRP would need to recover and hold $2.20-$2.30 in order for conditions to materially improve, and as of right now that appears unlikely.
The unsettling truth is that XRP is more likely to accelerate downward than to rebound. The market will cease debating direction and begin repricing risk if $2 breaks decisively. Hesitancy is penalized at this level, and optimism typically shows up too late.
Disclaimer: The content of this article solely reflects the author's opinion and does not represent the platform in any capacity. This article is not intended to serve as a reference for making investment decisions.
You may also like
The Emergence of CFTC-Regulated Clean Energy Platforms and Their Influence on Institutional Investment Approaches
- CFTC-approved CleanTrade, the first SEF for VPPAs/RECs, transforms clean energy markets by addressing liquidity, transparency, and regulatory challenges. - Its $16B trading volume and Cargill-Mercuria's first transaction demonstrate institutional adoption of standardized, verifiable renewable energy assets. - CleanTrade enables ESG alignment through project-specific carbon tracking, reducing emissions by 15% for investors while complying with IRA-driven $2.2T global investments. - By bridging financial a

Clean Energy Market Fluidity and the Rise of CleanTrade: Strategic Considerations for Investors in a Regulatory Environment
- CleanTrade, a CFTC-approved SEF, addresses fragmented pricing and low liquidity in clean energy markets by standardizing VPPA, PPA, and REC trading. - The platform’s $16B in two-month transactions demonstrates institutional demand for transparent, ESG-aligned tools to hedge energy risks and track carbon impact. - By centralizing renewable derivatives and aligning with regulations like SFDR, CleanTrade lowers barriers for investors and developers, accelerating decarbonization while boosting market efficie

The Rise of a Dynamic Clean Energy Marketplace
- Global clean energy investment hit $2.1 trillion in 2024, driven by decarbonization trends and institutional demand. - REsurety's CFTC-approved CleanTrade platform addresses liquidity gaps by standardizing VPPA/REC trading with oil-like transparency. - The platform processed $16 billion in two months, enabling risk mitigation and rapid capital reallocation amid policy shifts. - Advanced analytics and structured workflows transform clean energy assets into tradable instruments, attracting diversified inst

The Rise of a Dynamic Clean Energy Market and What It Means for Institutional Investors
- A liquid clean energy marketplace is emerging, enabling institutional investors to trade renewable assets with traditional market efficiency. - E-fuels and platforms like CleanTrade ($16B in notional value) address hard-to-decarbonize sectors while Enel's blockchain-based systems enhance scalability. - Regulatory reforms (e.g., EPA RFS) and industry M&A activity support market growth, though high costs and fragmented standards remain challenges. - 84% of institutional investors plan to increase clean ene