
Hedera Whales Pick Up 3.4 Billion HBAR Despite the Dip — What Are They Seeing?

HBAR price is flat today after a sharp monthly drop of nearly 29%. It is still down about 6% over the past week. The trend looks weak, but the deeper picture is more complex. Retail demand is soft, yet whales have added significantly over the past two days. This mix of weakness and accumulation suggests
HBAR price is flat today after a sharp monthly drop of nearly 29%. It is still down about 6% over the past week. The trend looks weak, but the deeper picture is more complex. Retail demand is soft, yet whales have added significantly over the past two days.
This mix of weakness and accumulation suggests a base may be forming even though the price action still looks weak.
Weak Demand Meets Heavy Accumulation?
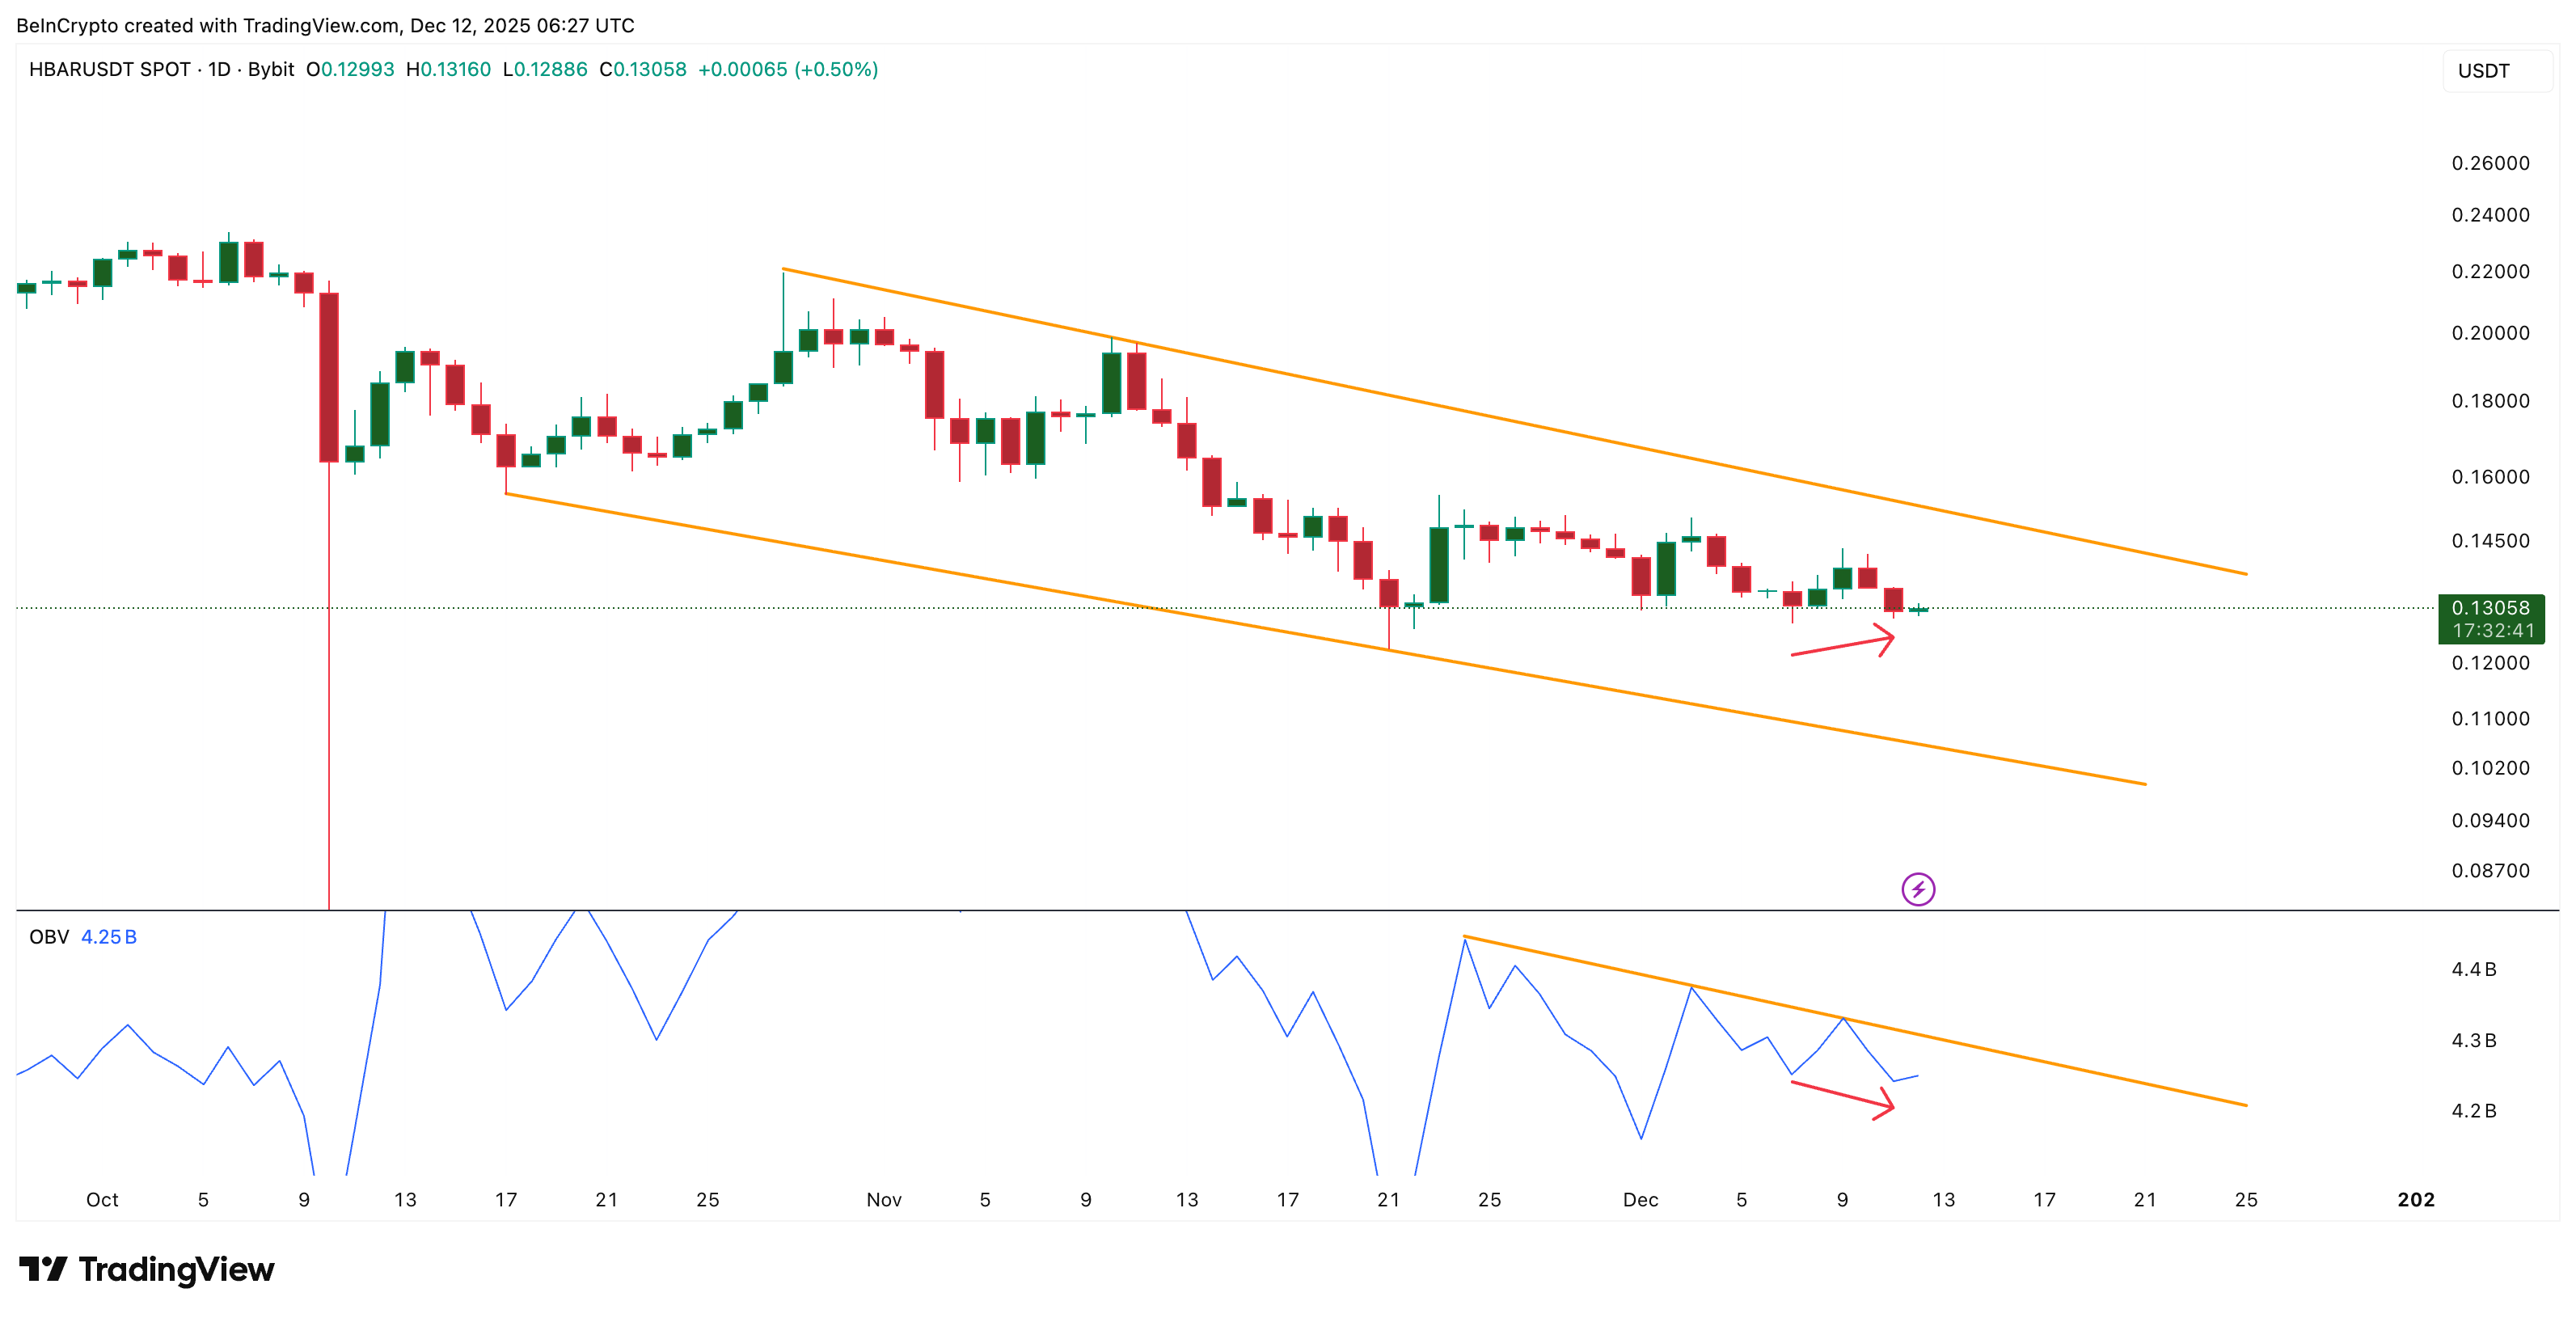
HBAR is still moving inside a falling wedge. A wedge is usually a bullish structure because it shows sellers losing strength over time. But inside that wedge, something weaker appeared. Between December 7 and December 11, the HBAR price made a higher low while the On-Balance Volume (OBV) made a lower low.
 Weak Retail Support:
TradingView
Weak Retail Support:
TradingView
Want more token insights like this? Sign up for Editor Harsh Notariya’s Daily Crypto Newsletter here.
OBV is a cumulative volume tool that tracks whether money is flowing in or out of a token. When price makes a higher low but OBV drops, buyers do not have enough strength to support the bounce. That creates a bearish divergence even inside a bullish pattern.
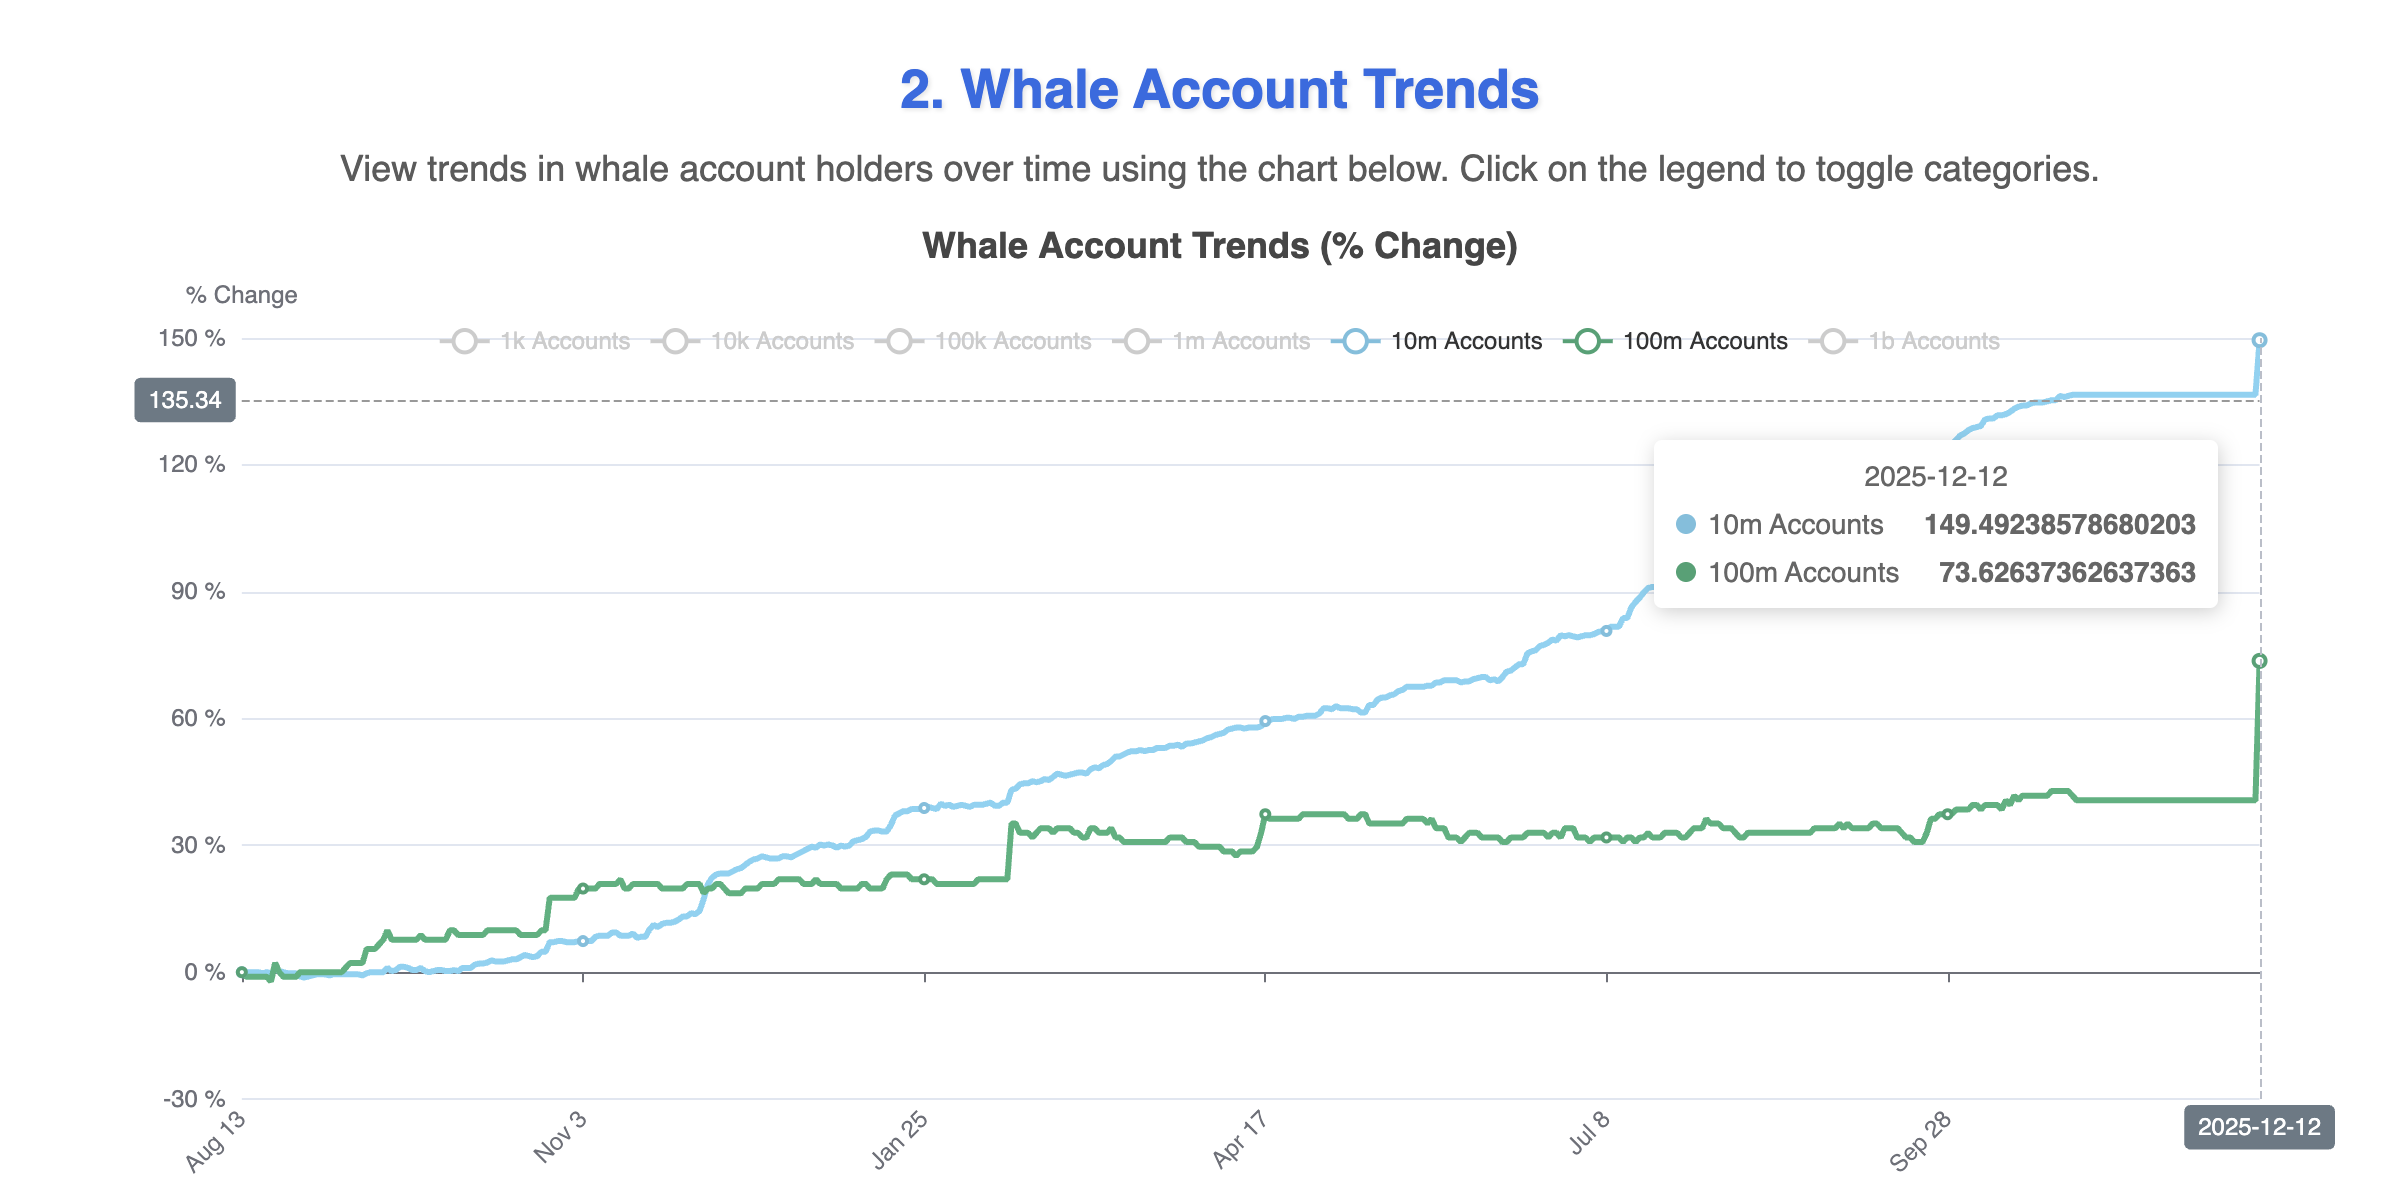
Whales, however, are acting very differently. Accounts holding at least 10 million HBAR increased from 136.54 to 149.49. Accounts with at least 100 million HBAR rose from 40.65 to 73.62. Using only the minimum thresholds, whales added about 3.42 billion HBAR in under 48 hours. At the current price, this stash is worth at least $445 million.
 HBAR Whales In Action:
Hedera Watch
HBAR Whales In Action:
Hedera Watch
OBV tracks traded volume on exchanges; large off-exchange transfers or OTC/custody moves may not appear in OBV, so OBV can miss some whale activity and is a better representation of retail interest.
This contradiction sets the stage for the next section, because whales are likely reacting to a deeper signal.
A Repeated Signal That Whales May Be Watching
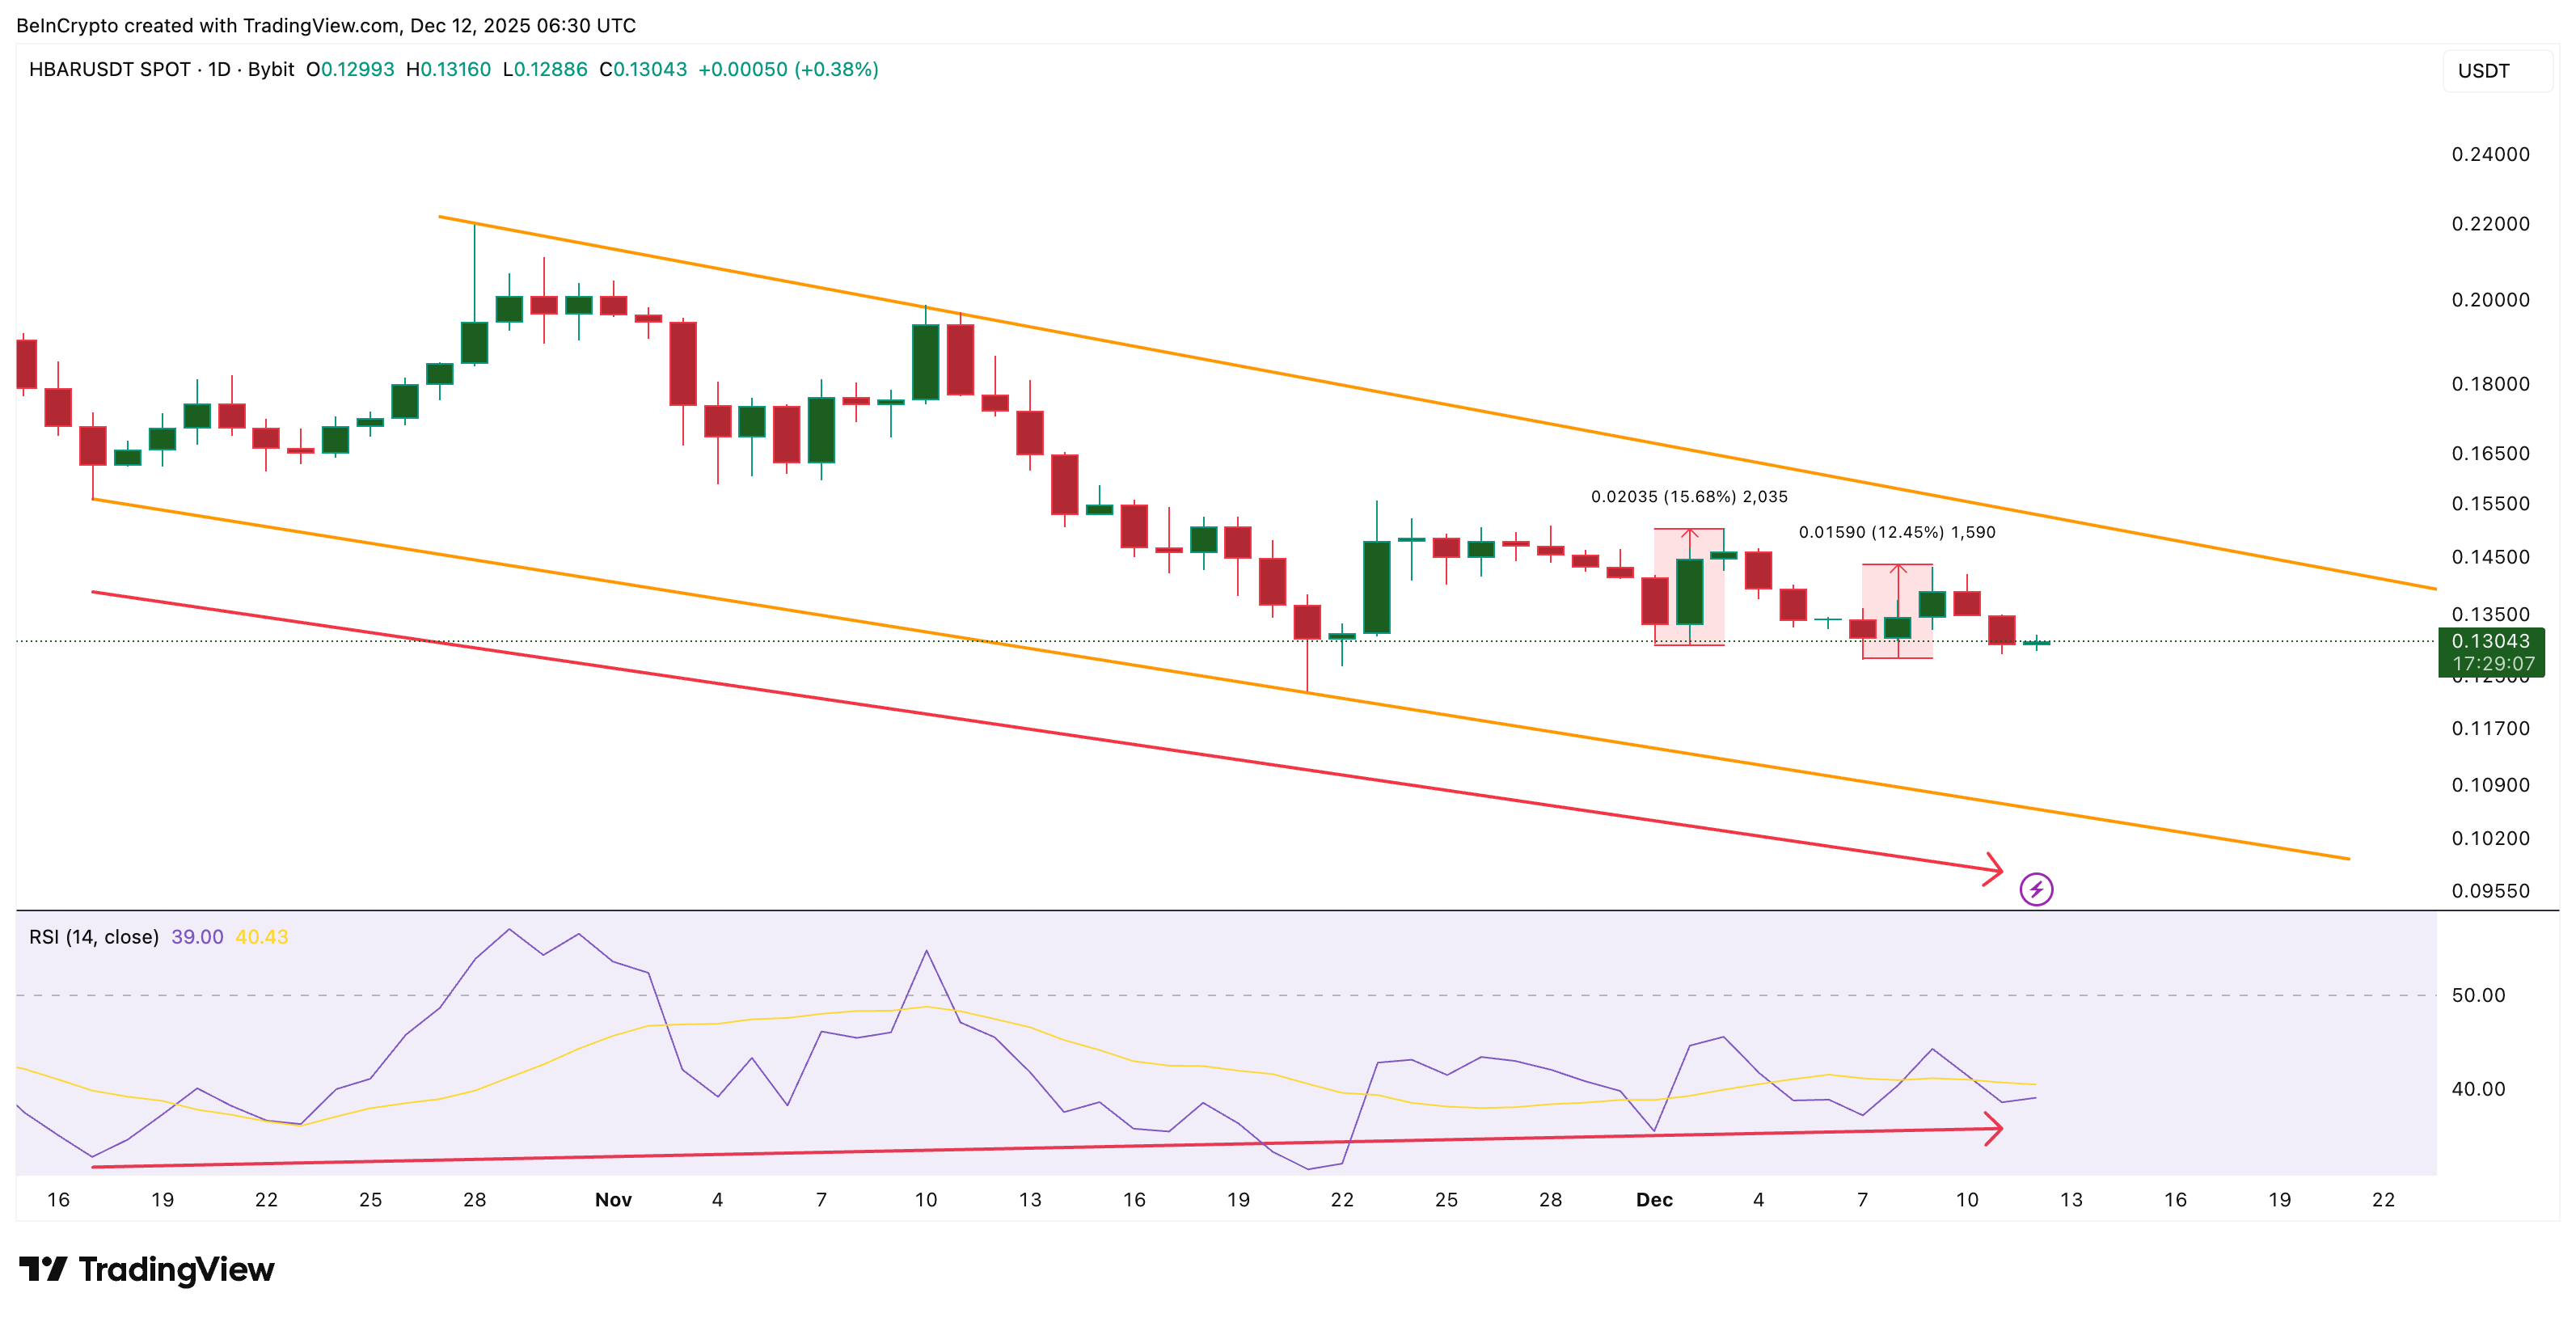
Between October 17 and December 11, the price made a lower low while the RSI (Relative Strength Index) made a higher low. RSI measures the speed of buying and selling. When price falls, but RSI rises, it forms a standard bullish divergence. This kind of divergence is linked with trend reversals.
This same divergence appeared before earlier bounces. On December 1 and December 7, the pattern showed up, and HBAR moved 15%, and 12% from the lows. Each move stalled at resistance, but this time the divergence shows up alongside massive whale accumulation. That combination makes the current reversal attempt more meaningful than the previous ones inside the wedge.
 RSI Divergence:
TradingView
RSI Divergence:
TradingView
If the caps that stopped the earlier rallies break, the divergence can shift the broader structure from bearish to bullish. That may be what whales are positioning for.
The Most Critical HBAR Price Levels
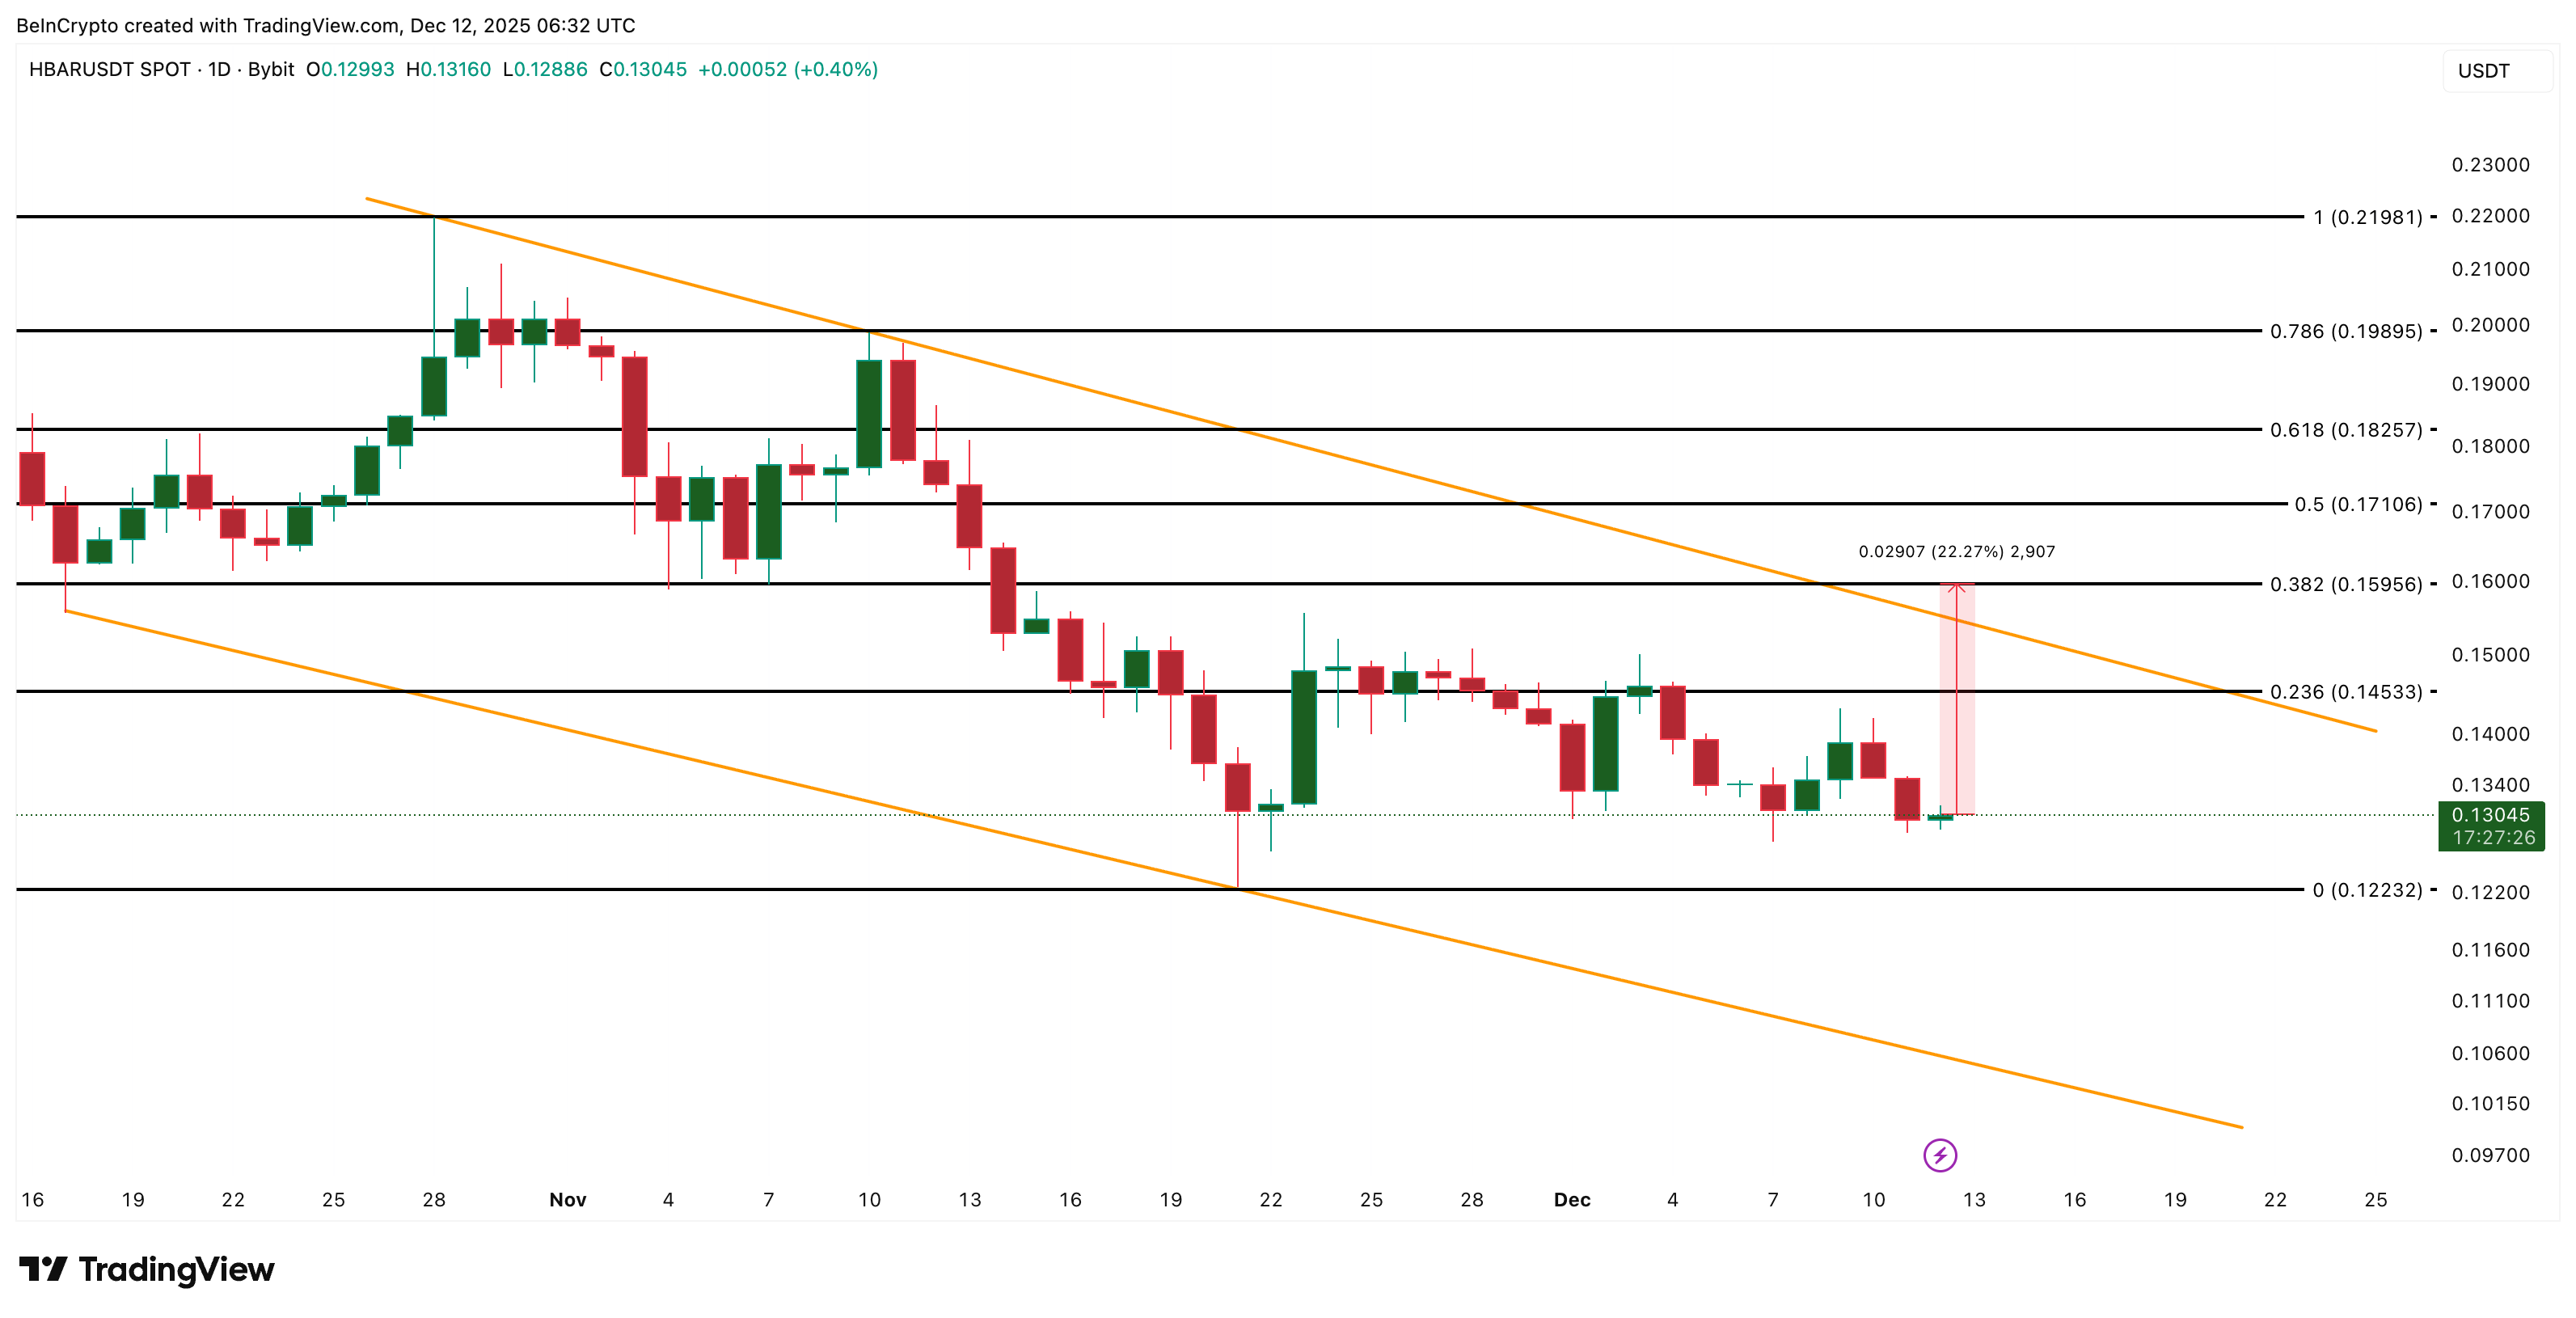
The HBAR price needs a daily close above $0.159. This level wasn’t breached during the previous bounces. A breakout above it also breaks the wedge’s upper trend line and opens room for a move toward $0.198 and $0.219.
If price weakens again, $0.122 is the line to watch. A drop below it sends HBAR back to the wedge’s lower boundary. That line is weak because it has only two touch points. A break below it delays any recovery and signals that sellers still control the broader trend.
 HBAR Price Analysis:
TradingView
HBAR Price Analysis:
TradingView
Right now, OBV shows weak demand, RSI shows a bullish setup, and whales have added about 3.42 billion HBAR at the lows. If HBAR can clear $0.159, the whale accumulation becomes a major tailwind instead of a background signal.
Read the article at BeInCryptoDisclaimer: The content of this article solely reflects the author's opinion and does not represent the platform in any capacity. This article is not intended to serve as a reference for making investment decisions.
You may also like
The Influence of Institutional Strategists on the Evolution of Long-Term Investment Patterns
- Thomas Sowell's analysis of market signals and decentralized systems shapes institutional investors' strategies to avoid policy-distorted markets. - His critiques of rent control and centralized interventions inform avoidance of regulated real estate and subsidy-dependent sectors like renewables. - The Hoover Institution amplifies Sowellian principles through data-driven policy advocacy, aligning with conservative investment frameworks prioritizing market-tested solutions. - While direct case studies are

PEPE Slips to $0.05459 as Traders Watch the Tight Gap Between Key Levels

ASTER Trades at $0.9562 After Trend Line Break Signals Stronger Momentum

Bitcoin Cash Surges 2.7% as Support Holds and Resistance Draws Focus
