
Pi Coin Price Faces Doomsday Risk After Pattern Break — Here’s How It Can Recover?

Pi Coin price had a steady run in November when most large tokens struggled. But the tone changed this week. The token is down almost 10% over the past seven days and more than 4% in the last 24 hours. The move under a key level confirmed a clear pattern break on the daily chart,
Pi Coin price had a steady run in November when most large tokens struggled. But the tone changed this week. The token is down almost 10% over the past seven days and more than 4% in the last 24 hours. The move under a key level confirmed a clear pattern break on the daily chart, which many traders might link with “doomsday” risk because it can push the price toward a new all-time low if selling continues.
The main question now is whether the chart can recover this time.
Pattern Breakdown Opens the Path to a New Low
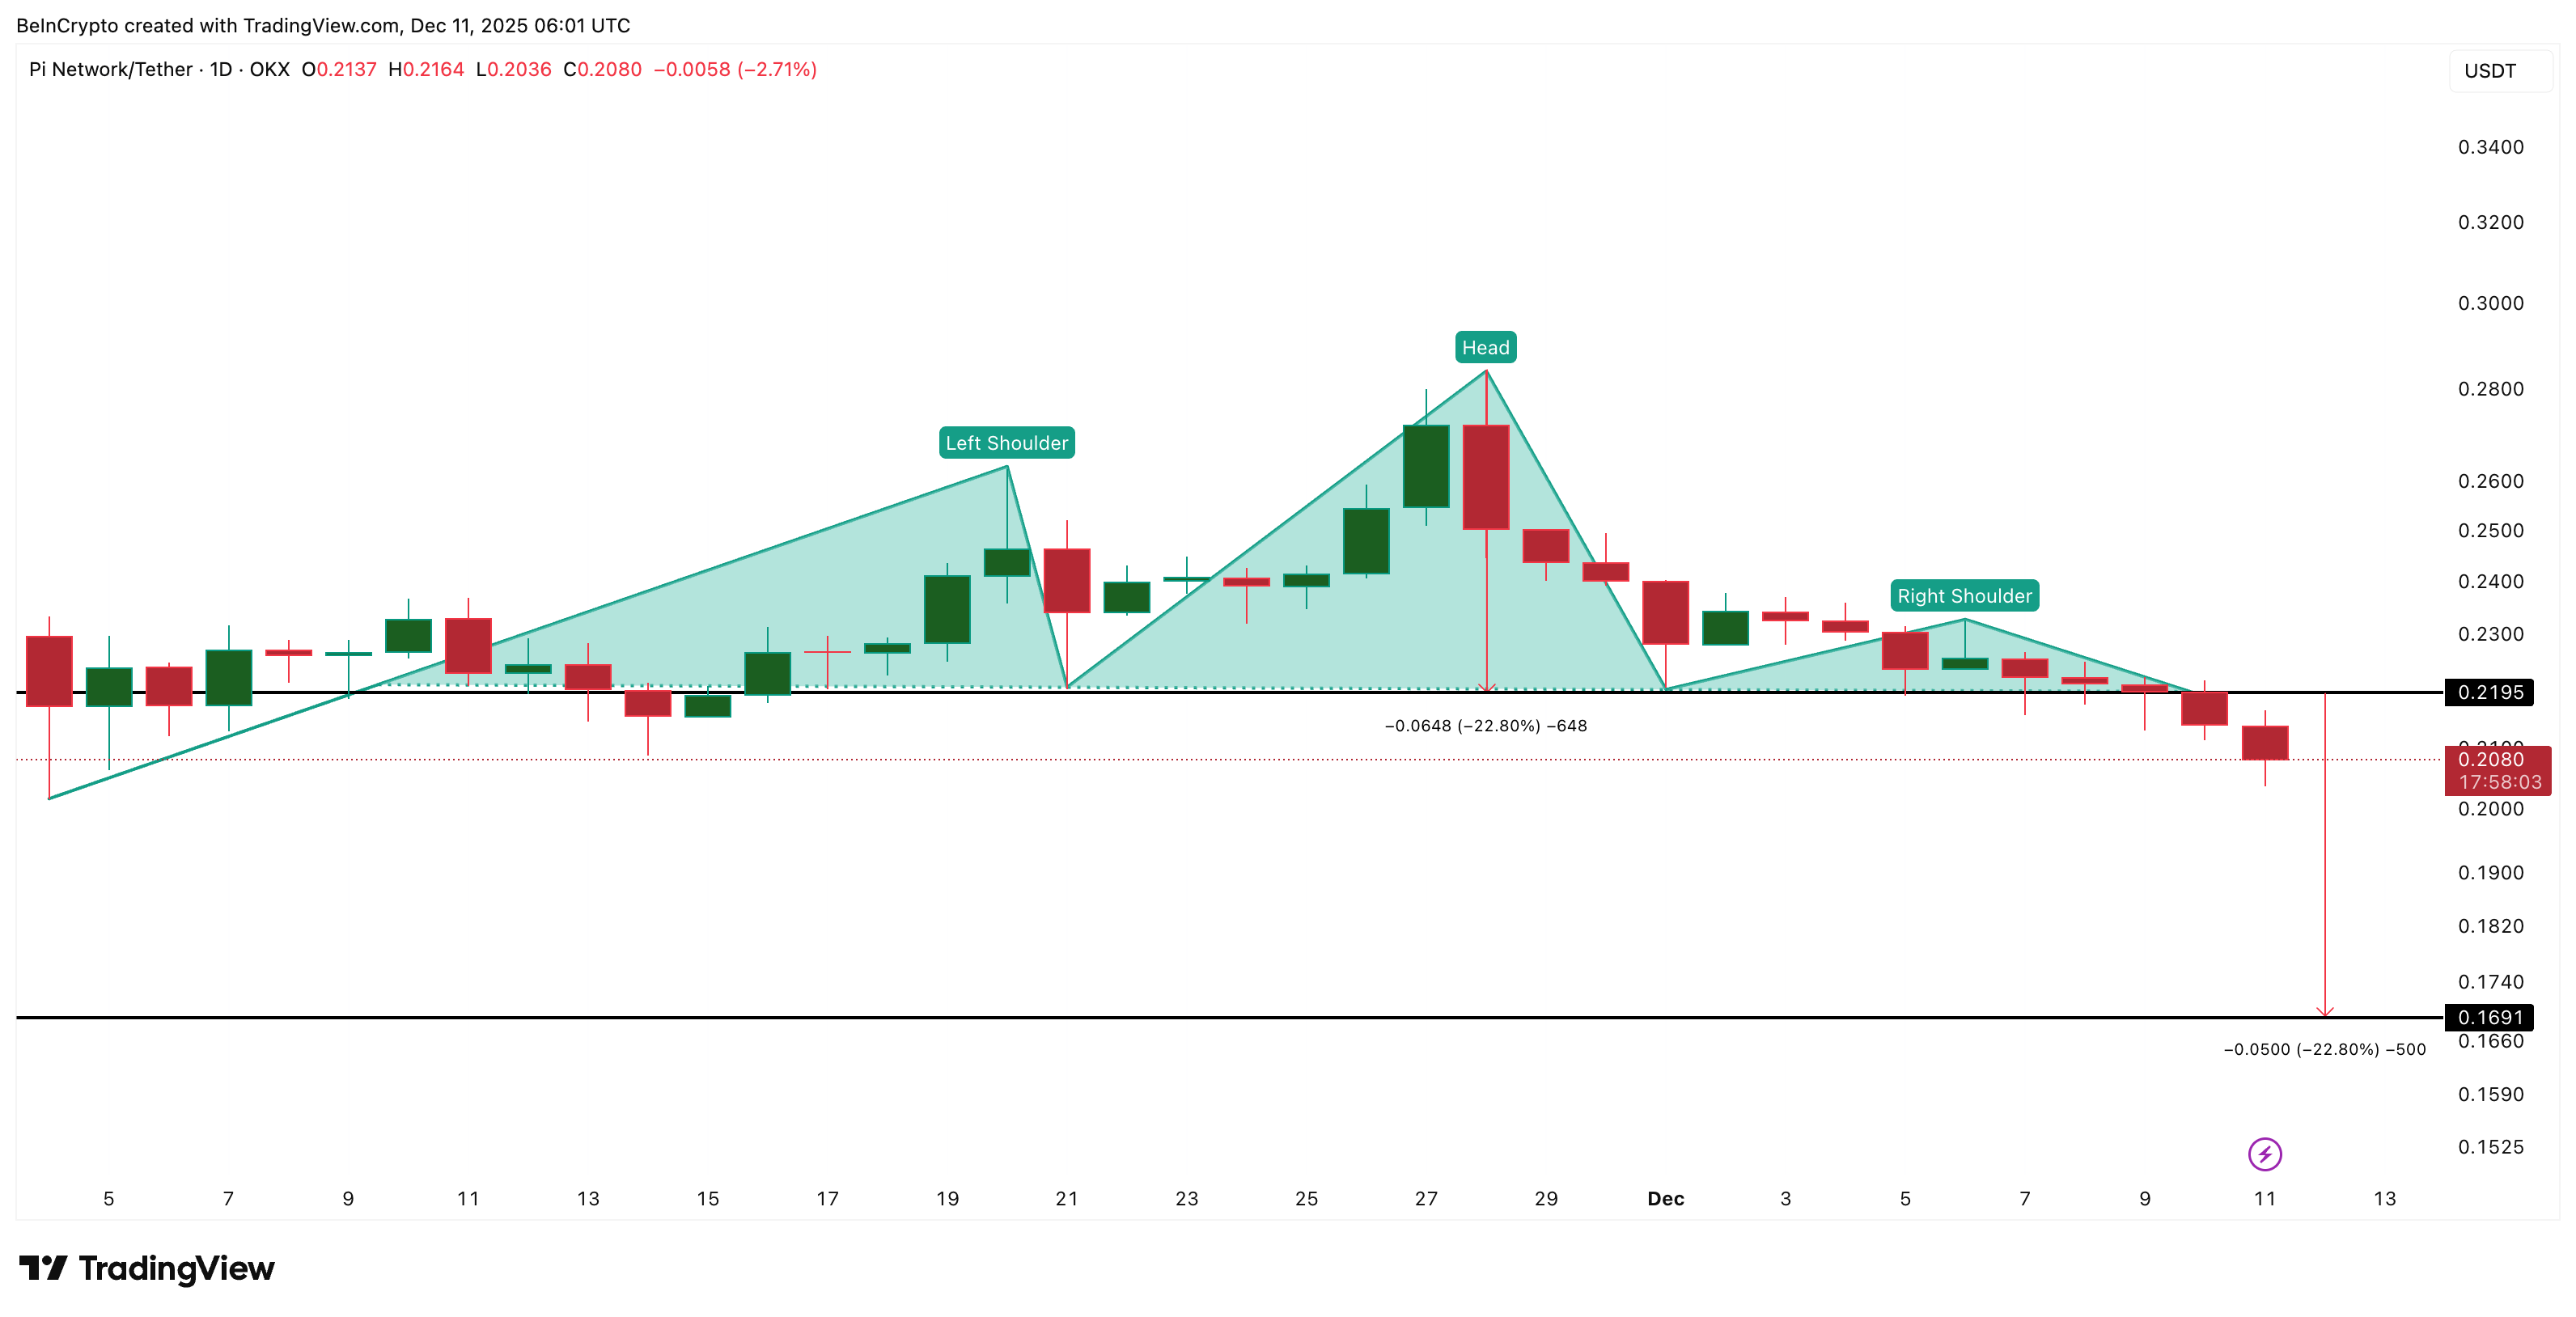
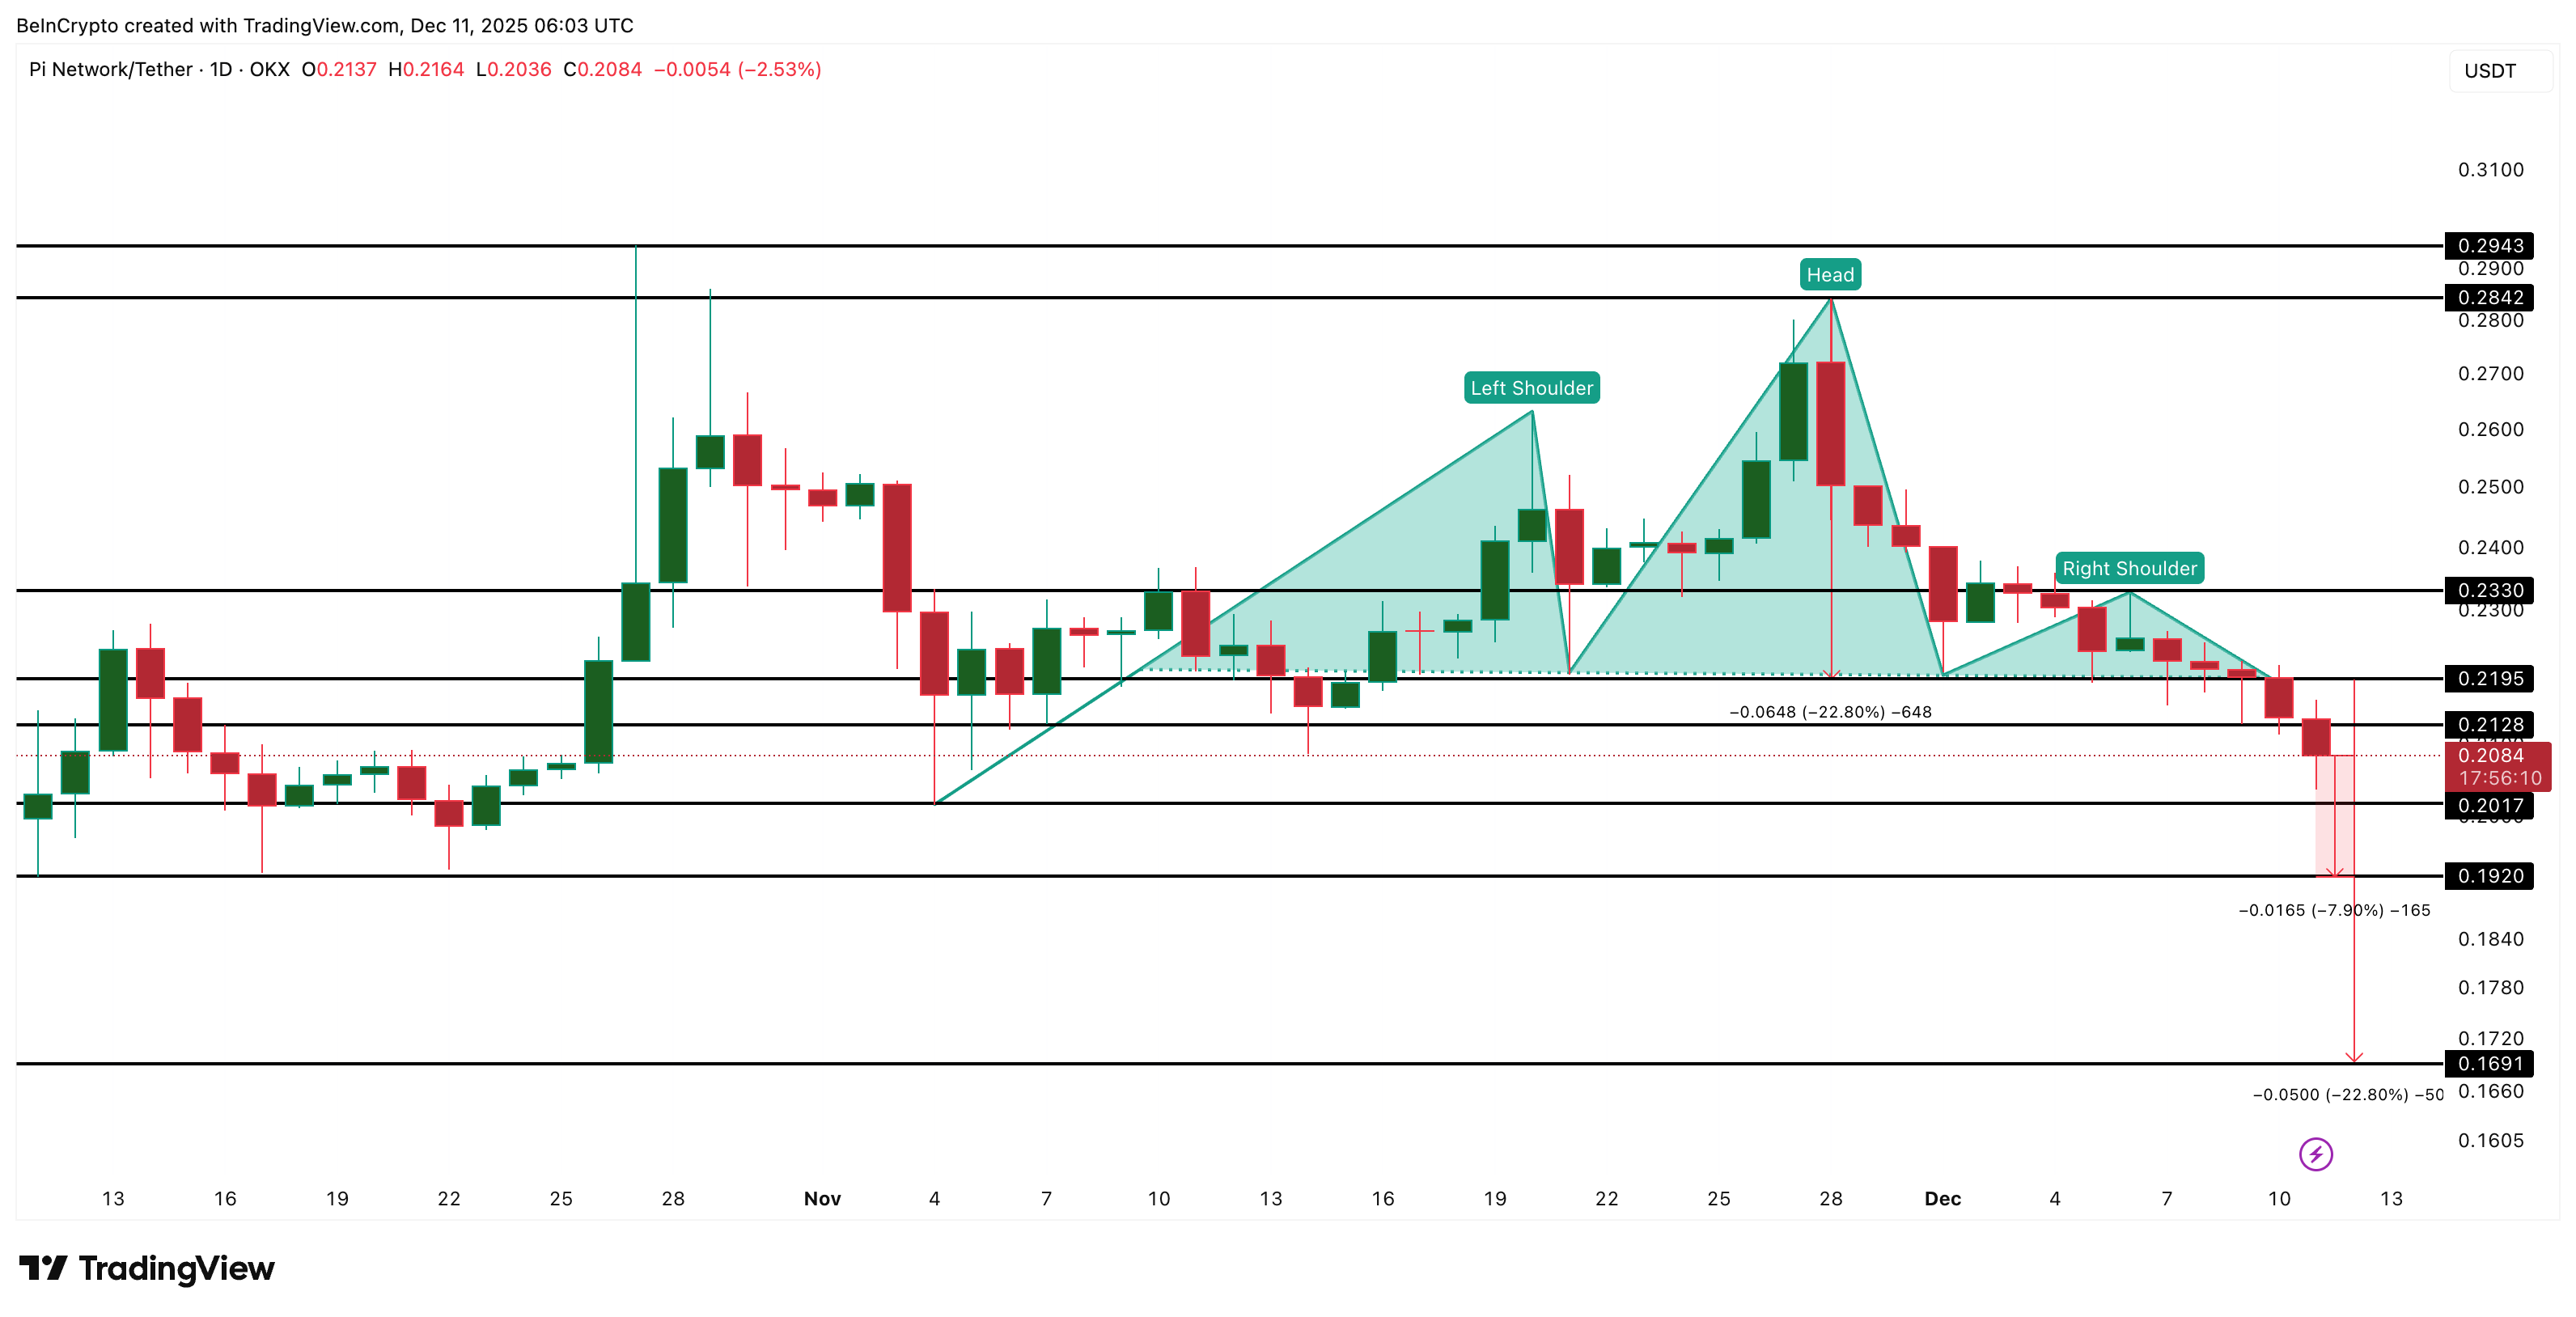
Pi Coin dropped below the neckline near $0.219, completing a standard head and shoulders pattern, signifying a possible bearish reversal.
The usual downside projection comes from the gap between the neckline and the head. That projection suggests a possible fall of about 22.8%, placing Pi Coin near $0.169.
 PI Price Risk:
TradingView
PI Price Risk:
TradingView
Want more token insights like this? Sign up for Editor Harsh Notariya’s Daily Crypto Newsletter.
This matters because Pi Coin’s current all-time low is near $0.172, so a move toward $0.169 would create a new low. But two metrics can still help PI avert the risk.
Sellers Are Strong, but Buyers Still Show Signs of Life
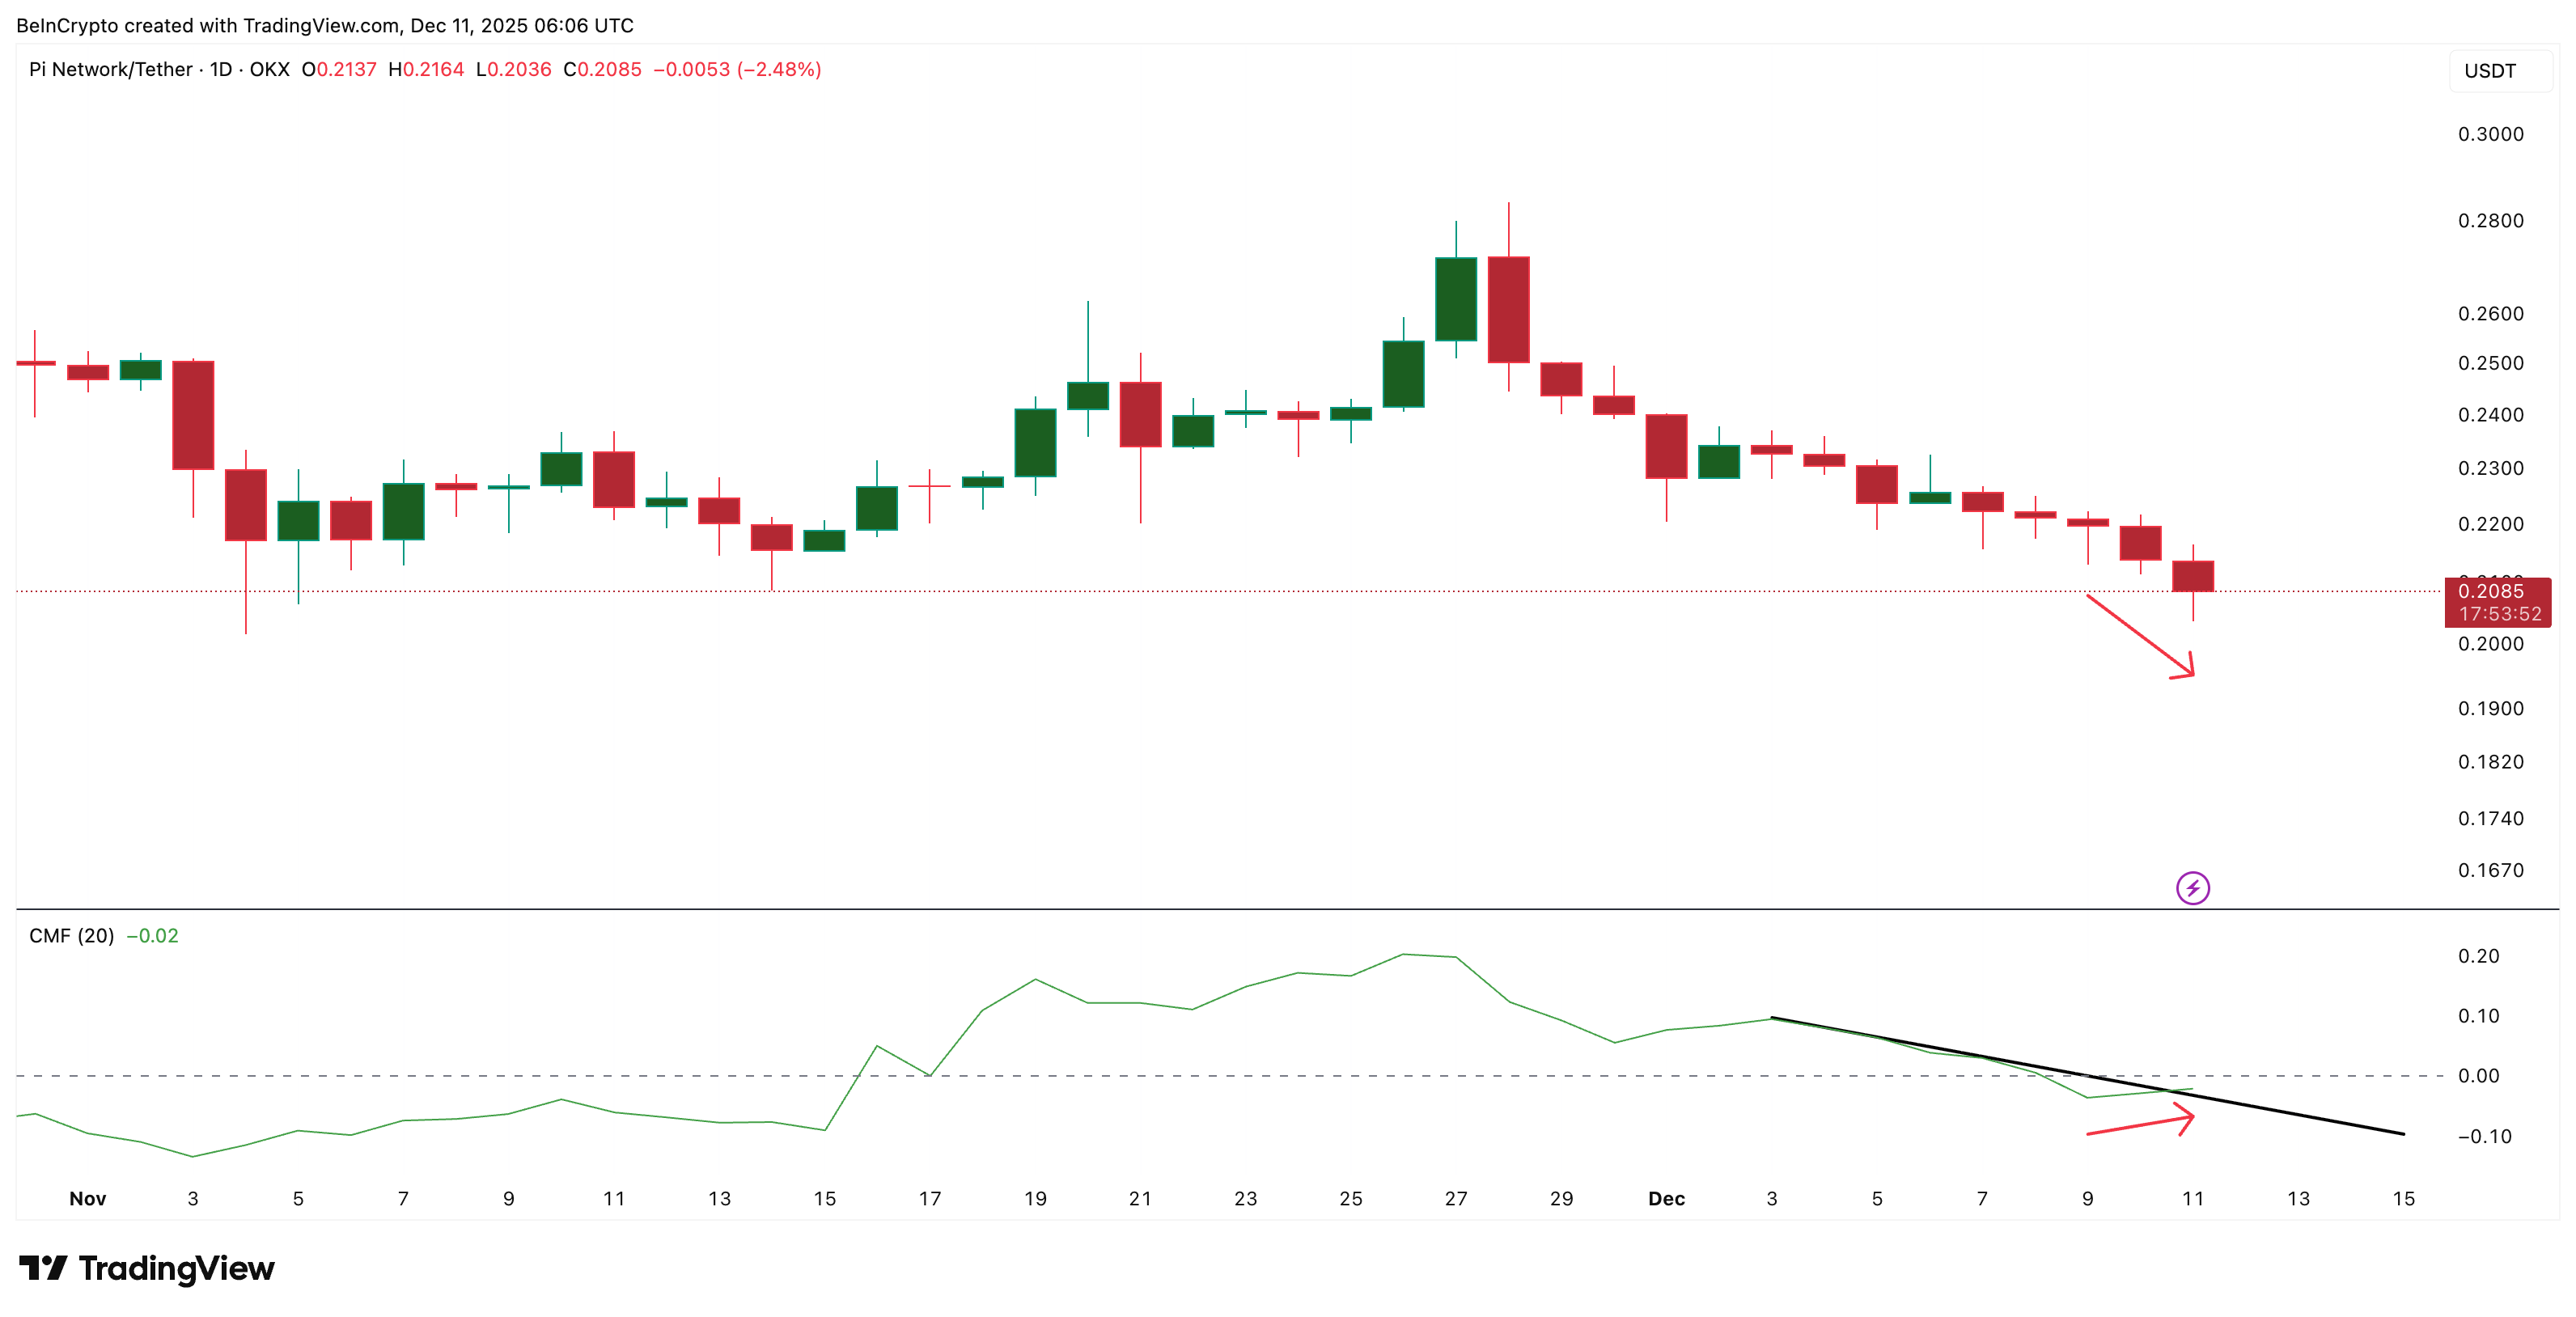
There are still hints of support from larger buyers. One sign comes from the money flow. The Chaikin Money Flow (CMF), which tracks how much big money is entering or leaving, shows a small divergence. Between December 9 and December 11, the price made a lower low, but the CMF trended higher. This usually signals that some buyers are absorbing the dips.
CMF has also broken above its short-term downtrend, but it has not yet moved over the zero line. The zero line is where money flow shifts from net selling to net buying. Pi Coin needs that shift to confirm strength.
 Money Flow Might Be Returning:
TradingView
Money Flow Might Be Returning:
TradingView
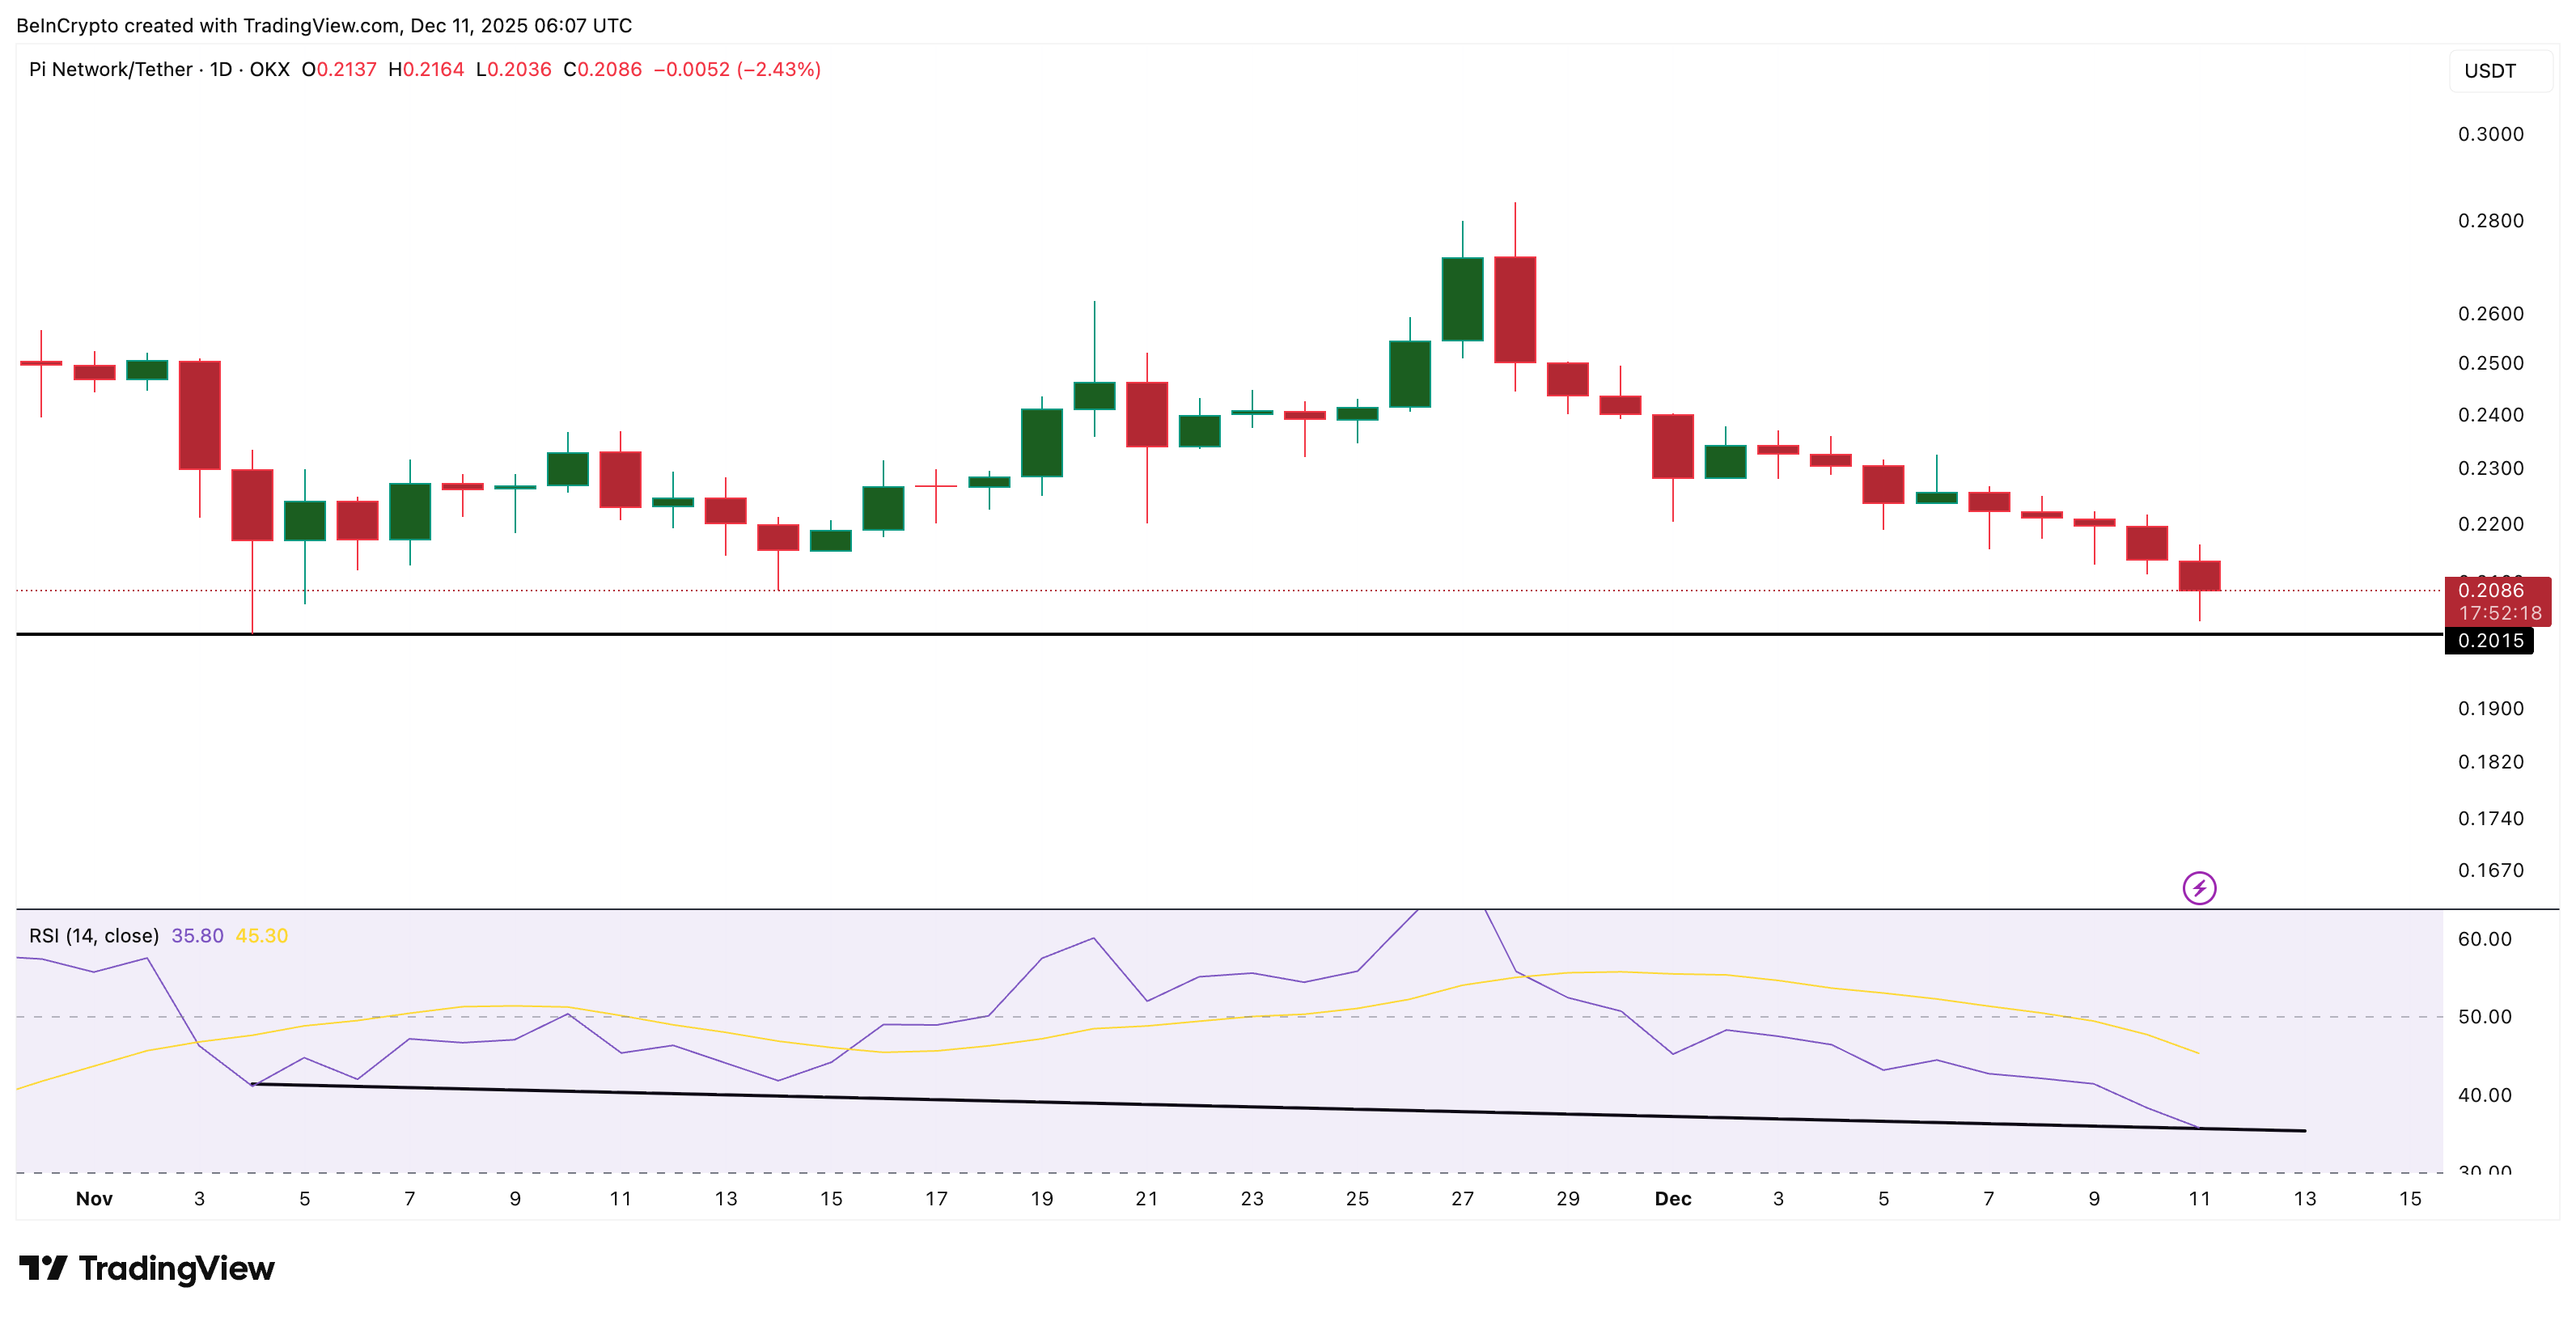
Momentum shows a similar picture. The Relative Strength Index (RSI), which measures buying pressure and selling pressure, formed a divergence of its own. Between November 4 and December 10, the PI price made a higher low, but the RSI made a lower low — hidden bullish divergence. This can mean that the selling pressure is starting to weaken.
 Hidden Bullishness Surfaces:
TradingView
Hidden Bullishness Surfaces:
TradingView
These early signals do not reverse the breakdown, but they show that sellers do not have full control.
Key Pi Coin Price Levels Decide The Fate
The Pi Coin price trades near $0.208 at press time. The most important line is $0.192. A break below it would open the path toward $0.169—the pattern target — and lock in a fresh low for the chart.
For a recovery, Pi Coin must first reclaim $0.233. This level sits above the right shoulder and would show early improvement. A full trend reversal only happens if the price moves above $0.284, which is the zone above the head of the pattern.
 Pi Coin Price Analysis:
TradingView
Pi Coin Price Analysis:
TradingView
Right now, Pi Coin sits between pressure and early support signs. The breakdown points to a new low, but the divergences show that buyers are still active. The next move depends on whether the price holds the $0.192 support or gives in to the downtrend.
Disclaimer: The content of this article solely reflects the author's opinion and does not represent the platform in any capacity. This article is not intended to serve as a reference for making investment decisions.
You may also like
COAI Experiences Significant Price Decline in Late November 2025: Is the Market Overreacting or Does This Present a Contrarian Investment Chance?
- ChainOpera AI (COAI) plummeted 90% in late 2025 due to CEO resignation, $116M losses, and regulatory ambiguity from the CLARITY Act. - Market panic and 88% supply concentration in top wallets amplified the selloff, while stablecoin collapses worsened liquidity risks. - Contrarians highlight C3 AI's 26% YoY revenue growth and potential 2026 regulatory clarity as signs of mispriced long-term AI/crypto opportunities. - Technical indicators suggest $22.44 as a critical resistance level, with analysts warning

Hyperliquid (HYPE) Price Rally: An In-Depth Look at Protocol Advancements and Liquidity Trends
- Hyperliquid's HYPE token surged 3.03% amid HIP-3 upgrades enabling permissionless perpetual markets and USDH stablecoin launch. - Protocol innovations boosted liquidity by 15% but failed to halt market share erosion to under 20% against competitors like Aster. - Structural challenges persist through token unstaking, unlocks, and OTC sales, yet HyENA's $50M 48-hour volume signaled renewed engagement. - Whale accumulation of $19.38M near $45-46 and HYPE buybacks aim to stabilize price, though long-term suc

ChainOpera AI Token Plummets Unexpectedly: Is This a Warning Sign for Crypto Investors Focused on AI?
- ChainOpera AI's 96% value collapse in late 2025 exposed critical risks in centralized, opaque AI-driven crypto projects. - 87.9% token concentration in ten wallets enabled manipulation, while untested AI algorithms and lack of audits eroded trust. - Regulatory ambiguity from delayed U.S. CLARITY Act and EU AI Act created fragmented frameworks, deterring institutional participation. - Post-crash trends prioritize decentralized governance, auditable smart contracts, and compliance with AML/KYC protocols fo

Modern Monetary Theory and the Transformation of Cryptocurrency Valuation Models in 2025
- Modern Monetary Theory (MMT) reshaped crypto valuation in 2025, transitioning digital assets from speculative tools to institutional liquidity instruments amid low-yield environments. - Central banks and 52% of hedge funds adopted MMT-aligned CBDCs and regulated stablecoins, with BlackRock's IBIT ETF managing $50B as crypto gained portfolio diversification status. - Regulatory divergence (e.g., U.S. CLARITY Act vs. New York BitLicense) created volatility, exemplified by the Momentum (MMT) token's 1,300%
