
Polkadot bulls test “home” range as DOT revisits long-term $2 accumulation zone

Polkadot trades near $2 inside a long-term accumulation “home” range flagged since 2022, where Egrag Crypto sees structural support but no confirmed bottom yet.
- DOT has returned to a price band an analyst labels a long-term accumulation zone, after a sharp intraday drop and subsequent stabilization around $2.
- Egrag Crypto frames the area as a structural floor using Wyckoff accumulation logic, liquidity wicks, and Polkadot’s multi-chain role, while still allowing for deeper downside.
- Inclusion in a Bitwise index and potential cycle-bottom dynamics support a long-term accumulation thesis, but traders are watching whether buyers defend this “home” range again.
Polkadot ( DOT ) traded near $2 on Friday as the cryptocurrency returned to a price level chart analyst Egrag Crypto has identified as a long-term accumulation zone since June 2022.
The token experienced a sharp intraday decline before consolidating around the price area, according to market data. Egrag Crypto, in a recent post, stated the current range represents what the analyst has termed the asset’s “home” range.
The analyst disclosed accumulating the token at higher levels and adding positions more recently at lower prices. Egrag Crypto characterized the range as a structural floor based on historical price behavior and Polkadot’s position in multi-chain infrastructure, according to the post.
Polkadot trending on Bitwise
The analyst cited Polkadot’s inclusion in the Bitwise index fund and its multi-blockchain capabilities as factors supporting a long-term investment case. Egrag Crypto noted that an October price wick may represent either a black swan event or a cyclical retest of lower liquidity zones consistent with four-year market cycles.
Chart data showed the token briefly rising above short-term resistance before reversing and dropping to lower levels where it stabilized. Trading volume increased during the early rally before shifting as sellers entered the market during the decline, according to the data .
Egrag Crypto’s analysis references Wyckoff accumulation structures, cycle timing, and Polkadot’s historical pattern of revisiting deep liquidity levels before recovering. The analyst’s framework poses questions including which Wyckoff schematic applies to current price structure, whether the current level represents a bottom, and potential upside targets if a cycle bottom confirms.
The analyst maintains a long-term accumulation approach while acknowledging uncertainty about whether the token has formed a final bottom or could decline further, according to the post.
Market participants are now monitoring whether buyers view the current price region as a long-term opportunity or whether market conditions will push the cryptocurrency lower into its accumulation band.
Disclaimer: The content of this article solely reflects the author's opinion and does not represent the platform in any capacity. This article is not intended to serve as a reference for making investment decisions.
You may also like
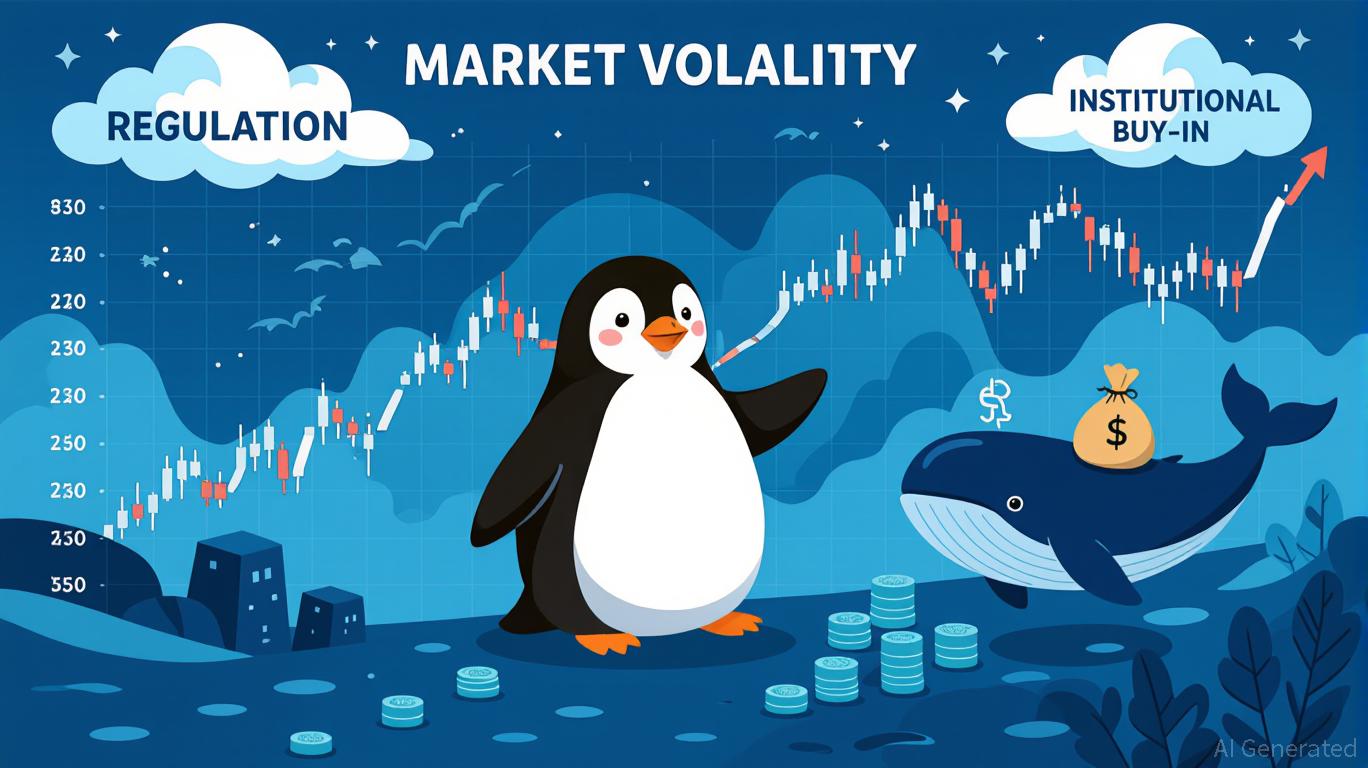
PENGU Price Forecast for 2025: Steering Through Regulatory Challenges and Growing Institutional Confidence
- Pudgy Penguins (PENGU) faces regulatory uncertainty from SEC delays and EU MiCA, causing 30% price drops due to compliance risks. - Institutional interest grows with $273K whale accumulation and rising OBV, contrasting retail fear (Fear & Greed Index at 28). - Ecosystem expansion via Pudgy World and penguSOL, plus Bitso partnership, aims to boost utility but depends on user adoption and regulation. - Expert forecasts diverge: $0.02782 (CoinCodex) vs. $0.068 (CoinDCX), with technical analysis highlighting
PENGU USDT Selling Indicator and What It Means for Stablecoin Approaches
- PENGU/USDT's 2025 collapse triggered $128M liquidity shortfall, exposing systemic risks in algorithmic stablecoins. - Technical indicators (RSI 40.8, bearish MACD) and 52.55% 30-day price drop signal deepening market distrust. - Regulatory frameworks (GENIUS Act, MiCA) and AI-driven risk analytics emerge as critical responses to algorithmic vulnerabilities. - Experts urge hybrid models combining CBDC stability with AI governance to address algorithmic stablecoins' inherent fragility.
Hyperliquid (HYPE) Token: Analyzing the Drivers and Longevity Behind Its Latest Price Rally
- Hyperliquid's HYPE token surged to $42.03 in 2025 from $3.20, driven by product upgrades (HyperEVM, HyperCore) and institutional adoption. - Strategic partnerships with Anchorage Digital and Circle , plus regulatory compliance, boosted credibility and decentralized trading volume (73% market share by 2025). - Bitcoin's $123k high in July 2025 correlated with HYPE's peak, reflecting broader crypto market optimism for low-fee decentralized futures infrastructure. - Sustainability risks include token unlock

The Emergence of Hyperliquid: Transforming DeFi Trading with a Novel Approach
- Hyperliquid dominates 73% of decentralized perpetual futures market with $317.6B 2025 trading volume, driven by institutional-grade infrastructure and on-chain innovations. - Platform's CLOB technology enables precise price discovery and sub-second finality, outperforming AMM-based competitors while maintaining DeFi composability. - HYPE token's deflationary model (97% fee buybacks) and institutional partnerships with Anchorage Digital/Circle accelerate liquidity growth and mainstream adoption. - Cross-c
