Bitget App
Trade smarter
Buy cryptoMarketsTradeFuturesEarnSquareMore
Near Protocol (NEAR) To Surge Higher? Key Pattern Formation Signals Potential Upside Move

Near Protocol (NEAR) To Surge Higher? Key Pattern Formation Signals Potential Upside Move

CoinsProbeCoinsProbe2025/12/08 14:30
By:Nilesh Hembade

Date: Mon, Dec 08, 2025 | 06:58 AM GMT

The broader crypto market is beginning to stabilize after a volatile weekend, with both Bitcoin (BTC) and Ethereum (ETH) recovering more than 2% today. This shift in sentiment is allowing several altcoins to reenter upward trajectories, including Near Protocol (NEAR), which is now showing signs of technical strength backed by a developing bullish structure.

Near Protocol (NEAR) To Surge Higher? Key Pattern Formation Signals Potential Upside Move image 0 
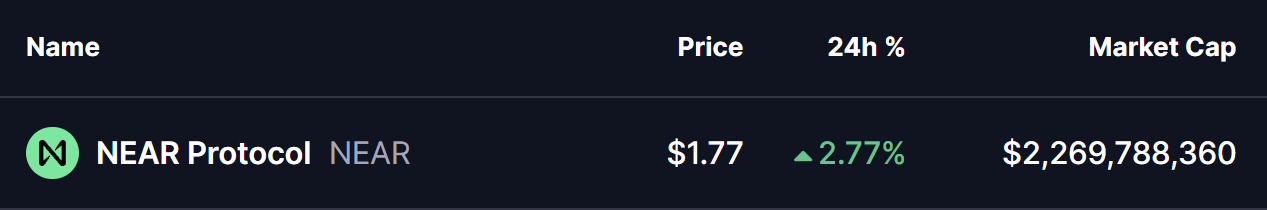
Source: Coinmarketcap

Harmonic Pattern Hints at Potential Upside

On the 4-hour chart, NEAR is carving out a Bearish Butterfly harmonic pattern. While traditionally labeled bearish at completion, this setup usually drives stronger upside during its CD leg, before reaching the final reversal zone. The ongoing price movement suggests that NEAR is currently in that upward phase.

The pattern began at Point X near $1.989, followed by a corrective pullback into Point A. A rebound into the Point B region marked temporary resistance, before price retraced again into Point C near $1.643—an area now acting as the foundational support of the entire structure. From that point, NEAR has rebounded firmly and is currently trading around $1.77, indicating renewed buyer engagement.

Near Protocol (NEAR) To Surge Higher? Key Pattern Formation Signals Potential Upside Move image 1 
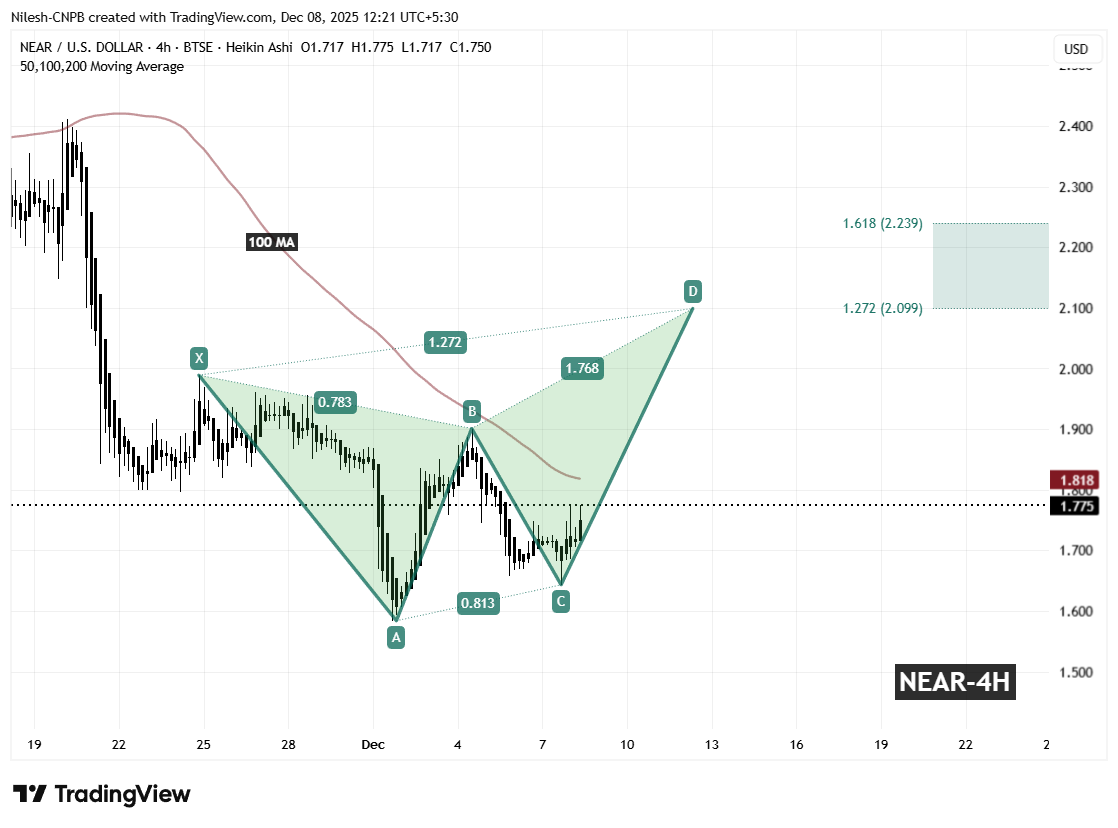
Near Protocol (NEAR)/Coinsprobe (Source: Tradingview)

Price is now pushing toward the 100 moving average at $1.818, a level that aligns directly with harmonic progression. A close above this threshold will be a key trigger for continuation, allowing bullish momentum to gather further strength.

What’s Next for NEAR?

As long as NEAR maintains structure above $1.643, the current pattern remains valid and technically constructive. If bullish pressure successfully breaks and sustains above the 100 MA, the harmonic projection points toward the Potential Reversal Zone (PRZ) between $2.099 and $2.239. This area represents the typical completion zone for the Butterfly formation and may provide NEAR with an upside window of nearly 18% before pattern exhaustion becomes relevant.

The near-term chart tone is also supported by improved momentum profiles, with emerging higher lows indicating strong participation from buyers even during small corrective pauses.

The road to the PRZ may include short-term resistance reactions, but if NEAR continues to build atop the 100 MA, the setup supports a breakout-driven move rather than a fade.

0
0

Disclaimer: The content of this article solely reflects the author's opinion and does not represent the platform in any capacity. This article is not intended to serve as a reference for making investment decisions.

PoolX: Earn new token airdrops
Lock your assets and earn 10%+ APR
Lock now!

You may also like

PENGU Price Forecast for 2025: Steering Through Regulatory Challenges and Growing Institutional Confidence

- Pudgy Penguins (PENGU) faces regulatory uncertainty from SEC delays and EU MiCA, causing 30% price drops due to compliance risks. - Institutional interest grows with $273K whale accumulation and rising OBV, contrasting retail fear (Fear & Greed Index at 28). - Ecosystem expansion via Pudgy World and penguSOL, plus Bitso partnership, aims to boost utility but depends on user adoption and regulation. - Expert forecasts diverge: $0.02782 (CoinCodex) vs. $0.068 (CoinDCX), with technical analysis highlighting

Bitget-RWA2025/12/13 07:14
PENGU Price Forecast for 2025: Steering Through Regulatory Challenges and Growing Institutional Confidence

PENGU USDT Selling Indicator and What It Means for Stablecoin Approaches

- PENGU/USDT's 2025 collapse triggered $128M liquidity shortfall, exposing systemic risks in algorithmic stablecoins. - Technical indicators (RSI 40.8, bearish MACD) and 52.55% 30-day price drop signal deepening market distrust. - Regulatory frameworks (GENIUS Act, MiCA) and AI-driven risk analytics emerge as critical responses to algorithmic vulnerabilities. - Experts urge hybrid models combining CBDC stability with AI governance to address algorithmic stablecoins' inherent fragility.

Bitget-RWA2025/12/13 06:56
PENGU USDT Selling Indicator and What It Means for Stablecoin Approaches

Hyperliquid (HYPE) Token: Analyzing the Drivers and Longevity Behind Its Latest Price Rally

- Hyperliquid's HYPE token surged to $42.03 in 2025 from $3.20, driven by product upgrades (HyperEVM, HyperCore) and institutional adoption. - Strategic partnerships with Anchorage Digital and Circle , plus regulatory compliance, boosted credibility and decentralized trading volume (73% market share by 2025). - Bitcoin's $123k high in July 2025 correlated with HYPE's peak, reflecting broader crypto market optimism for low-fee decentralized futures infrastructure. - Sustainability risks include token unlock

Bitget-RWA2025/12/13 06:40
Hyperliquid (HYPE) Token: Analyzing the Drivers and Longevity Behind Its Latest Price Rally

The Emergence of Hyperliquid: Transforming DeFi Trading with a Novel Approach

- Hyperliquid dominates 73% of decentralized perpetual futures market with $317.6B 2025 trading volume, driven by institutional-grade infrastructure and on-chain innovations. - Platform's CLOB technology enables precise price discovery and sub-second finality, outperforming AMM-based competitors while maintaining DeFi composability. - HYPE token's deflationary model (97% fee buybacks) and institutional partnerships with Anchorage Digital/Circle accelerate liquidity growth and mainstream adoption. - Cross-c

Bitget-RWA2025/12/13 06:40
The Emergence of Hyperliquid: Transforming DeFi Trading with a Novel Approach
© 2025 Bitget