With a sub‑30% underwater supply, Bitcoin price actions now looks eerily like early 2022

Bitcoin just spent two straight weeks sliding into a zone traders respect and fear at the same time. Price dropped toward the True Market Mean, the cost basis of all active coins minus miners, and then held there.
According to Glassnode, that level splits light bear phases from deep bear markets. For now, price is sitting just above it. The structure around it now matches what showed up in Q1 2022 almost tick for tick.
Spot price moved under the 0.75 supply quantile in mid‑November and now trades near $96.1K, putting more than 25% of total supply underwater.
At the same time, sellers may already be worn out. The line that changes everything is still the 0.85 quantile near $106.2K. Until price takes that level back, macro shocks keep full control of direction.
Glassnode data shows that Bitcoin’s Net Change in Realized Cap reads +$8.69B per month, which is pretty weak compared to the $64.3B per month peak in July, but it is not exactly negative either.
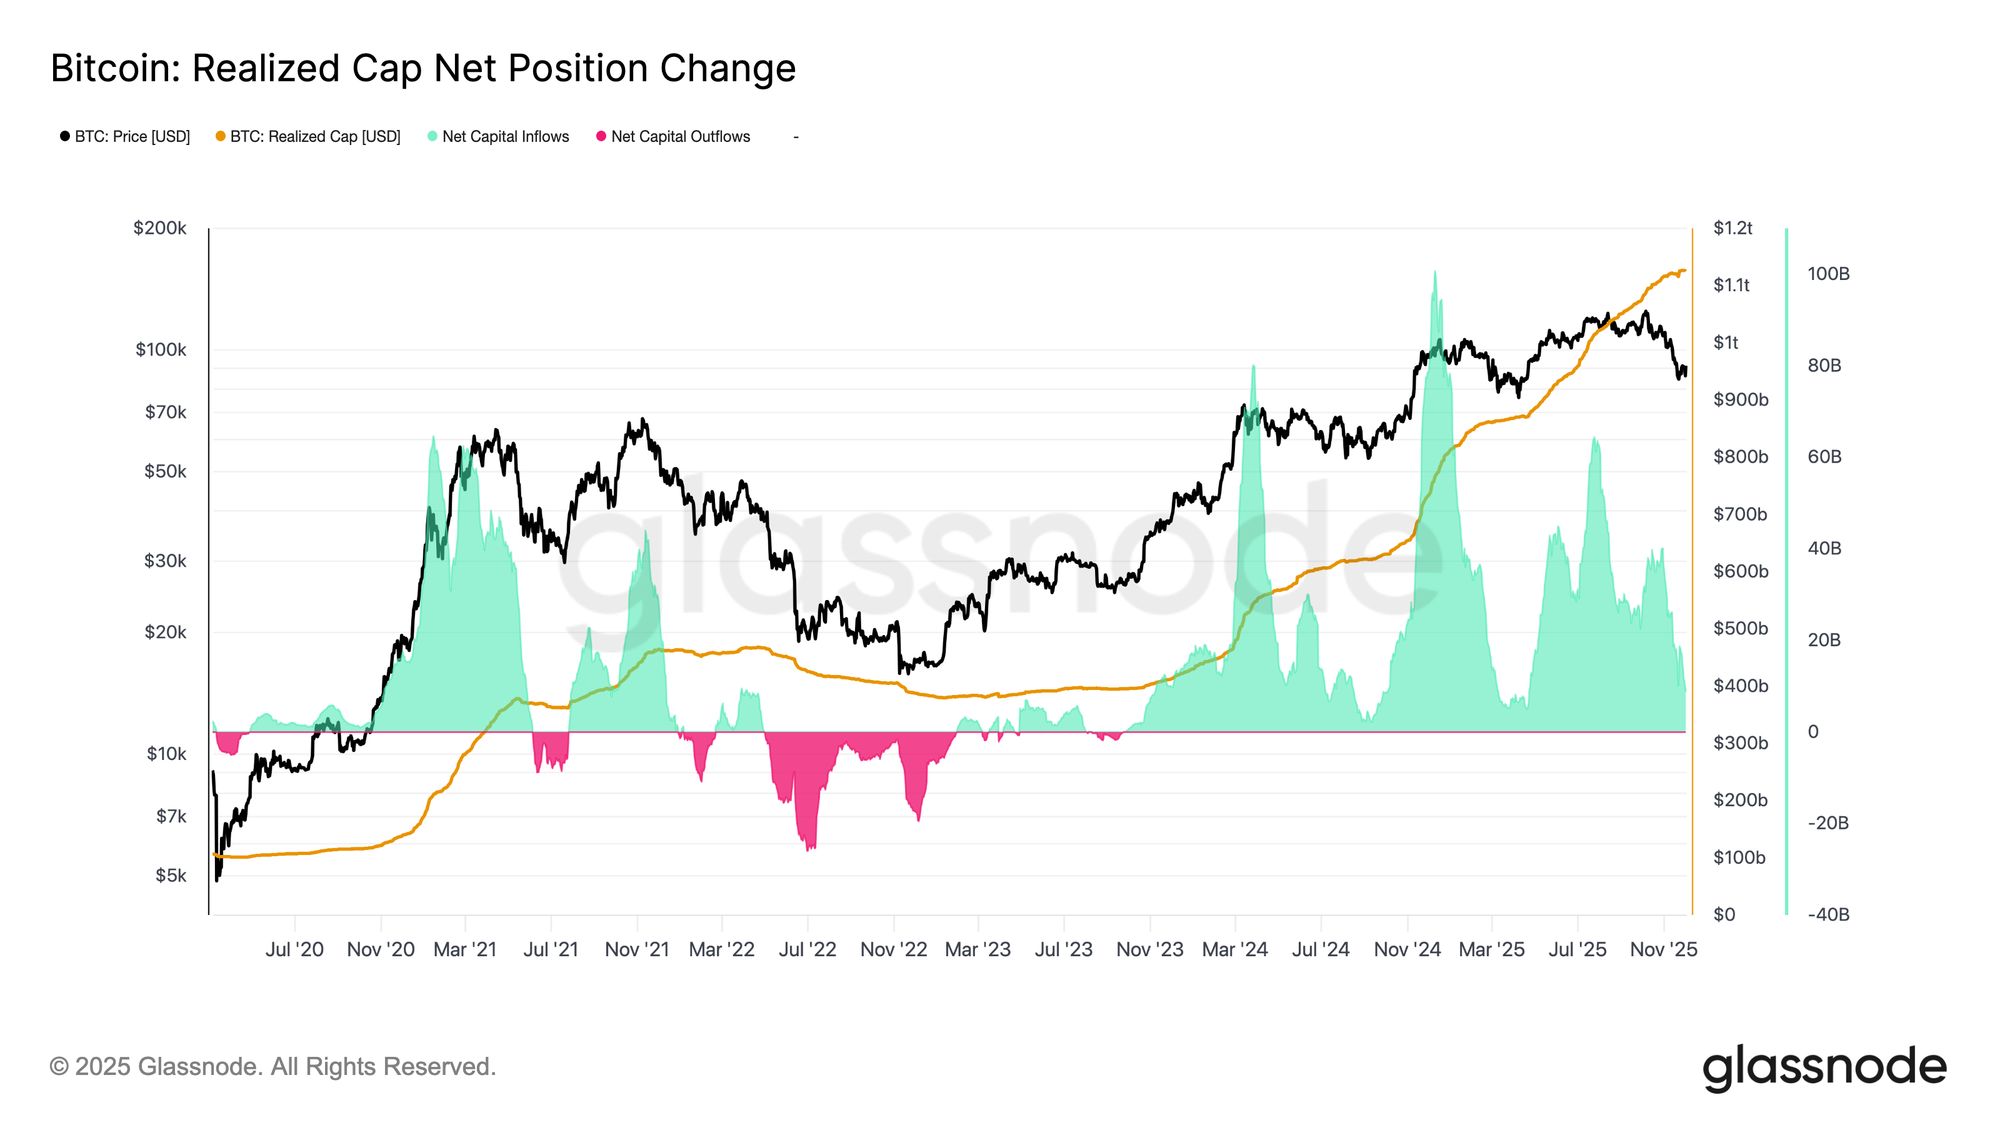
As long as this stays above zero, price can still build a base instead of falling apart. Meanwhile, long‑term investors continue to sell into strength, but at shrinking margins, with the Long‑Term Holder SOPR (30D‑SMA) stands at 1.43.
Derivatives and options reset risk across the board
Spot demand now looks lighter. U.S. Bitcoin ETFs flipped into net outflows across November on a three‑day average basis. The steady inflow that supported price earlier this year is gone. Outflows hit many issuers at once. Institutions pulled back as market pressure built. That leaves price more exposed to outside shocks.
At the same time, Cumulative Volume Delta turned negative on Binance and across the aggregate exchange group. That signals steady taker selling. Coinbase flattened as well. That removed a key sign of U.S. bid strength. With ETF flows and CVD both defensive, spot demand now runs thin.
Derivatives followed the same path. Futures open interest kept falling through late November. The unwind stayed slow and orderly. The leverage built during the uptrend is now mostly gone. New leverage is not entering. Funding rates cooled near zero after months of positive prints. Modest negative funding showed up at times but never lasted long. Shorts are not pressing hard. Positioning now sits neutral and flat.
In options, implied volatility dropped after last week’s spike. Bitcoin failed to hold above $92K, and sellers stepped back in, so short‑dated volatility fell from 57% to 48%, mid‑tenor slid from 52% to 45%, and long‑dated eased from 49% to 47%.
Short‑term skew fell from 18.6% to 8.4% after Bitcoin’s price rebounded from $84.5K, a drop tied to the Japanese bond shock. Longer maturities moved slower. Traders chased short‑term upside but stayed unsure about follow‑through.
Early week flow leaned heavy on put buying tied to fears of a repeat of the August 2024 carry‑trade stress. Once price stabilized, flow flipped to calls during the rebound.
At the $100K call strike, call premium sold still exceeds call premium bought, and the gap widened during the past 48 hours. That shows weak conviction to reclaim six figures. Traders also sit ahead of the FOMC meeting without chasing upside.
Crypto entrepreneur Lark Davis pointed out that crypto whales dumped the market, then “Charles Schwab, Vanguard and Bank of America all roll out crypto to their clients in the same week. What a happy coincidence!”
Disclaimer: The content of this article solely reflects the author's opinion and does not represent the platform in any capacity. This article is not intended to serve as a reference for making investment decisions.
You may also like
Tether (USDT) Price Fluctuations and Market Response to PENGU Sell Indicators: Assessing Potential Risks and Opportunities within a Divided Stablecoin Landscape
- Tether (USDT) faced 2025 depegging to $0.90, exposing reserve management flaws and triggering S&P's "weak" stability rating. - Algorithmic PENGU USDT's 28.5% price drop and $66.6M team outflows highlighted systemic risks in opaque collateral structures. - Regulatory shifts (GENIUS Act, MiCA) accelerated migration to compliant stablecoins like USDC , now dominating 30% of on-chain transaction volume. - Market fragmentation reveals dual dynamics: algorithmic risks vs. institutional adoption opportunities i
DASH Increases by 2.44% as Significant Insider Selling and Purchase Indicators Emerge
- DASH rose 2.44% in 24 hours to $50.1, showing a 31.63% annual gain despite a 11.79% seven-day drop. - High-ranking insiders sold millions via 10b5-1 plans, including $9. 3M by Stanley Tang and $6.19M by Andy Fang. - Alfred Lin’s $100.2M purchase signaled confidence, contrasting with other sales and suggesting undervaluation. - Market reacted positively short-term, but analysts expect macroeconomic and business fundamentals to support DASH ahead.

BCH Rises 36.52% Over the Past Year as Network Enhancements and Improved Mining Efficiency Drive Growth
- Bitcoin Cash (BCH) rose 36.52% in a year due to network upgrades and improved mining efficiency. - Growing merchant adoption boosts real-world use cases, enhancing BCH’s practical appeal. - Analysts predict continued momentum from stable updates and adoption efforts amid crypto volatility. - Recent stability, with no major forks, strengthens investor confidence in BCH’s scalability.

Why is COAI experiencing a downturn towards the end of 2025
- COAI token and index collapsed in late 2025 due to deteriorating market fundamentals, governance failures, and regulatory uncertainty. - C3 AI's Q3 2025 revenue growth (26% YoY) was overshadowed by Q1 2026 revenue decline (20% YoY) and leadership instability, eroding investor trust. - Token centralization (87.9% in ten wallets) and lack of transparent governance exacerbated liquidity crises and manipulation risks. - The CLARITY Act's ambiguity and jurisdictional loopholes deepened uncertainty, deterring