On the daily ETH/USD chart dated Dec. 3, 2025, Ethereum still trades inside a clear downtrend.
Price stays below the descending blue trendline and also below the 50-day exponential moving average near 3,363 dollars.
Stay ahead in the crypto world – follow us on X for the latest updates, insights, and trends!🚀
This structure shows that sellers still control the larger move even after the latest rebound.
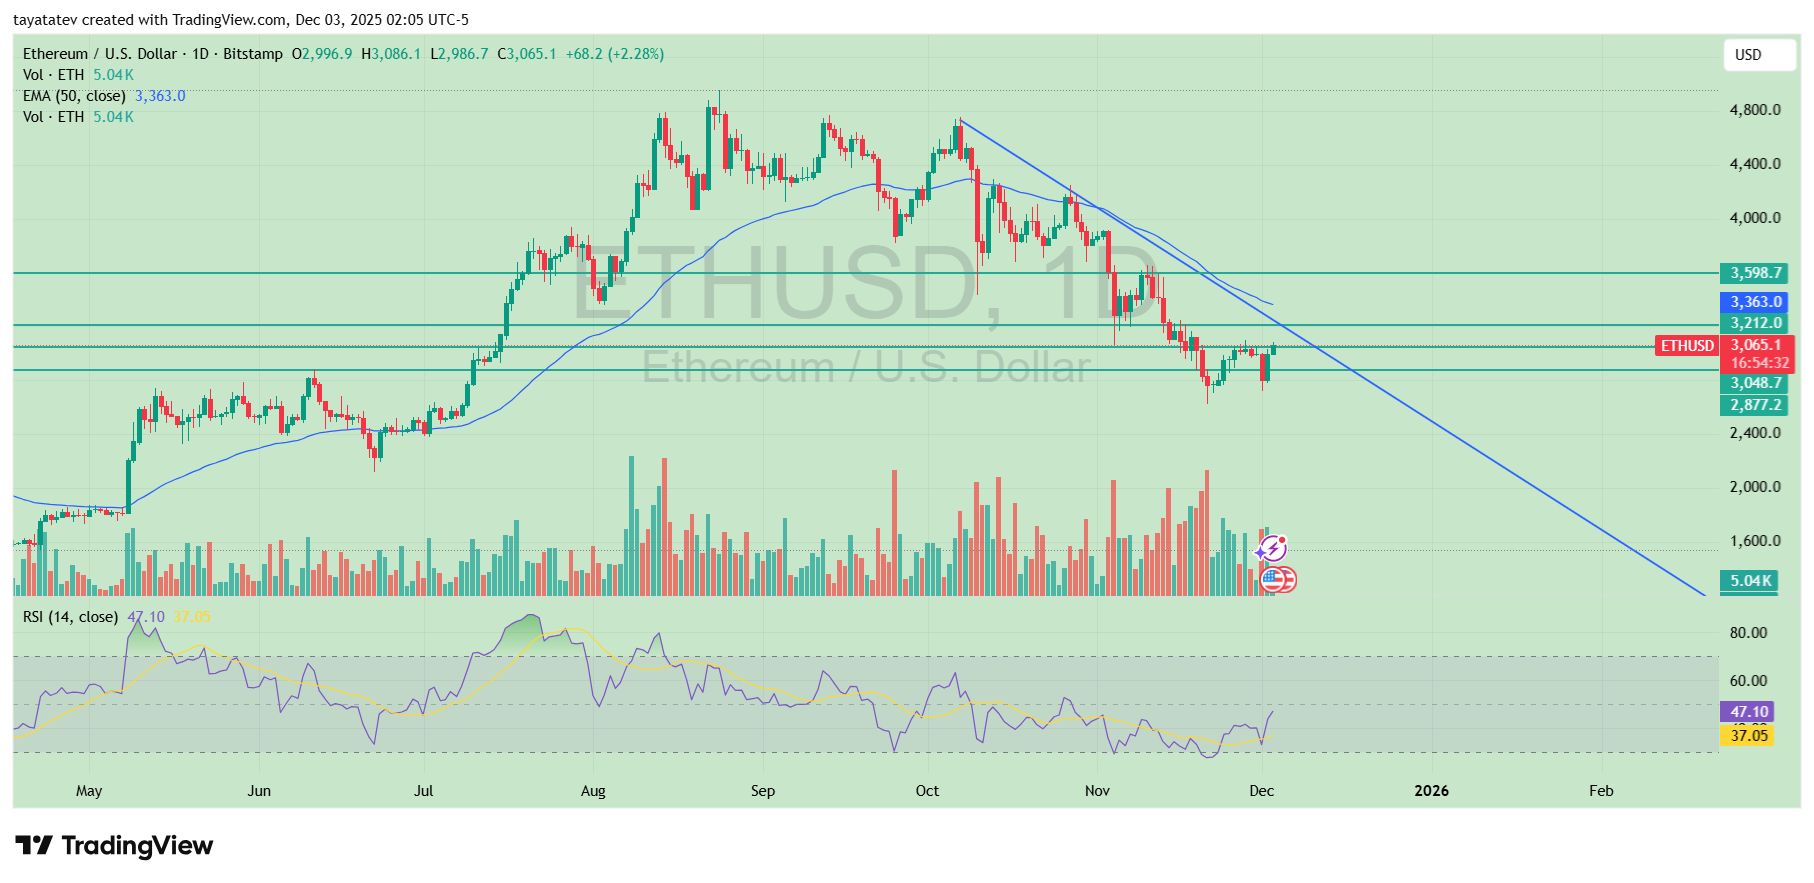 Ethereum Reversal Test at 3,212. Source: TradingView
However, the chart also shows the first signs of a potential short-term reversal attempt. ETH bounced from the horizontal support zone around 2,877 dollars and has now reclaimed the area near 3,048 dollars.
The daily close at about 3,065 dollars marks a higher low versus the November bottom and pushes price back toward overhead resistance.
At the same time, the RSI has turned up from near oversold levels and now sits around 47, which signals easing downside momentum rather than strong trend strength in either direction.
The key level on this chart sits at 3,212 dollars. This line marks the upper boundary of the current consolidation zone and stands just under the descending trendline.
If ETH breaks and holds above 3,212 dollars on the daily time frame, it would be the first clean close back above a major resistance since the selloff started.
In that case, price could then target the next resistance band near 3,363 dollars at the 50-day EMA, and after that the horizontal supply zone around 3,598 dollars that capped rallies earlier in the year.
Until such a breakout happens, the downtrend remains valid and the recent move counts as a corrective bounce inside it.
Support to the downside stays in the 3,048 to 2,877 dollar zone. A daily close back below that band would warn that sellers have regained control and that the reversal attempt has failed, while a strong move through 3,212 dollars would confirm that bulls finally forced a shift in the short-term structure.
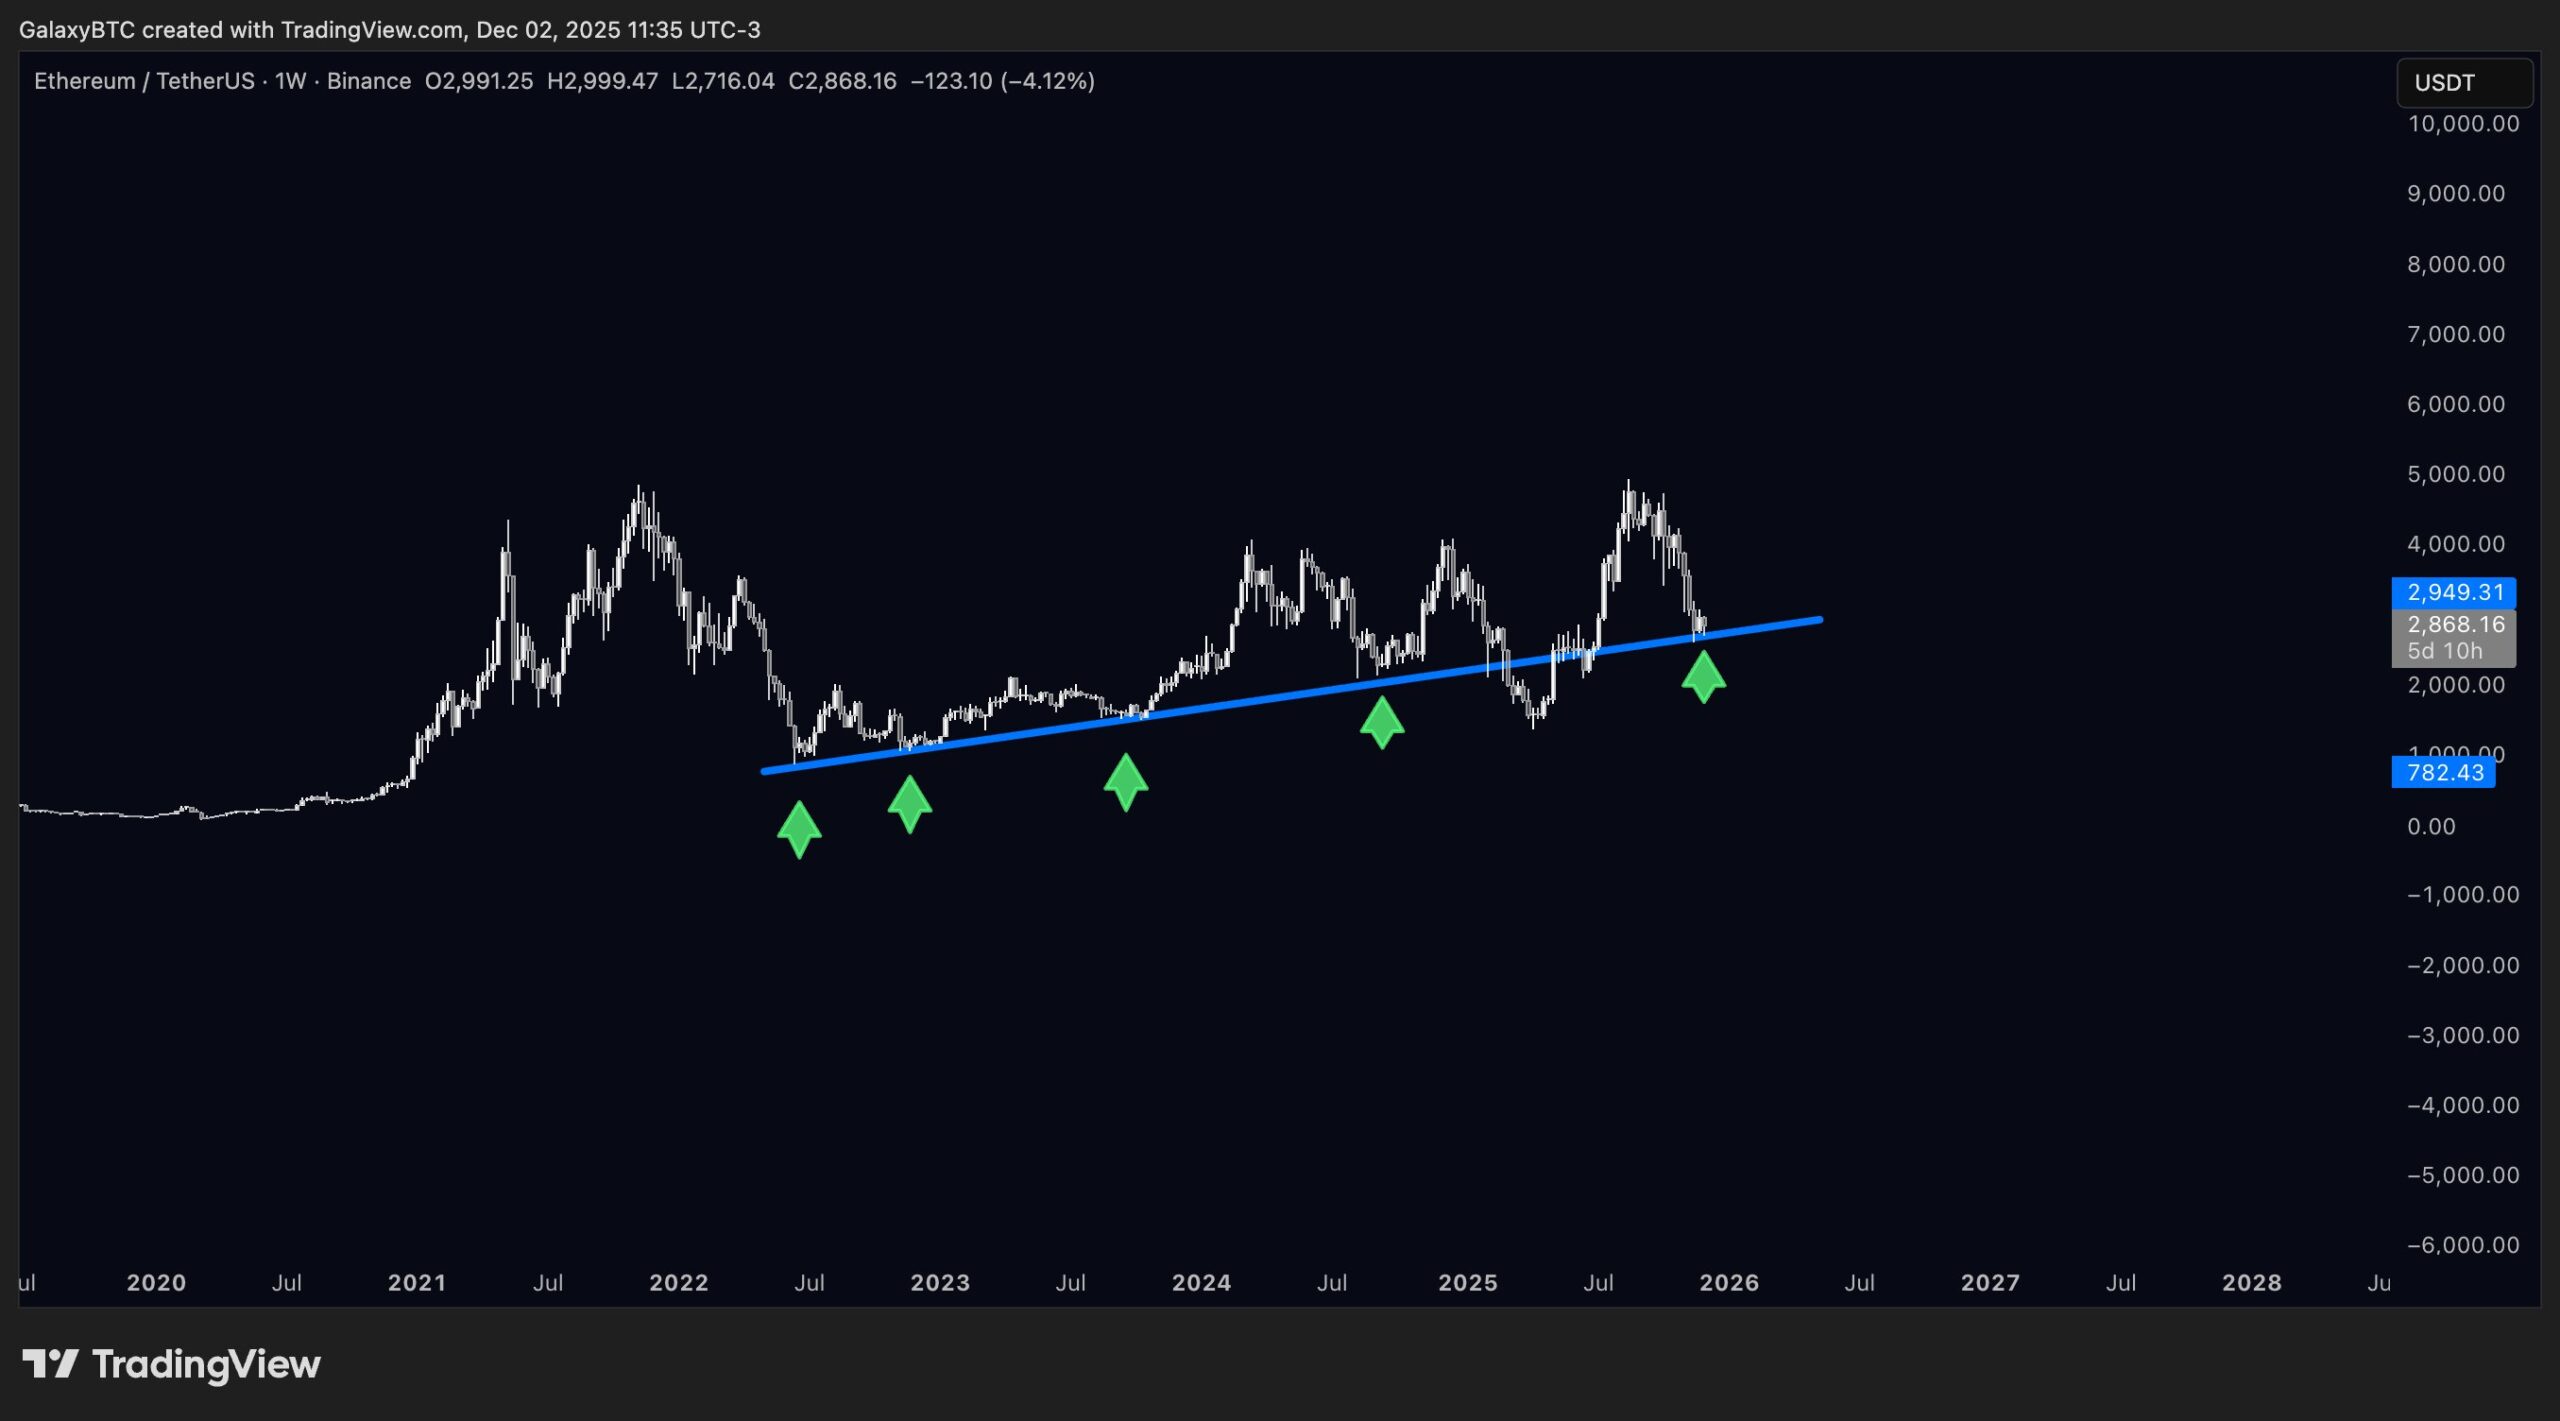 Ethereum Long-Term Bull Trendline Test. Source: GalaxyBTC on X