Bitcoin Cash Gains 1.9% to $518 Breaking Key Resistance

According to CoinDesk Research's technical analysis data model, BCH$525.33 posted solid gains during Wednesday's session, advancing 1.9% from $508.32 to $518.01 amid heightened volatility across crypto markets. The move established clear bullish momentum within a $32.78 trading range, representing 6.4% intraday volatility as BCH outperformed while most altcoins stumbled at key resistance zones.
The decisive break came at 13:00 UTC on Wednesday when BCH pierced resistance at $530.00 on exceptional volume of 39.3K units — 158% above the 24-hour moving average. After touching $532.16, the token consolidated in a descending channel with declining volume while maintaining higher lows and cementing support at $515.00.
Recent 60-minute action revealed a two-phase surge starting at 02:35 UTC on Thursday, with BCH jumping from $516.34 to $521.66 on volume of 3,276 units before pulling back toward $518.07. This pattern tested resistance near $521.50 before establishing fresh support around $518.00, reinforcing the broader bullish structure.
Technical momentum versus profit-taking
With no fundamental catalysts driving BCH specifically, technical levels dominated as the cryptocurrency navigated broader market chop. While BTC faced rejection near $107,000 and most altcoins sold off from resistance, BCH's hold above $515.00 support suggested accumulation by larger players.
The post-breakout consolidation indicated healthy price discovery, with diminishing volume during pullbacks showing limited selling interest. Traders now watch whether BCH maintains its technical edge as crypto markets work through overhead supply.
Key technical levels signal continuation pattern for BCH
Support/Resistance:
- Primary support locked at $515.00 following successful breakout sequence
- Secondary support zone between $499-503, tested twice on selling waves
- Key resistance at $521.50 based on recent 60-minute rejection patterns
- Upper target remains $530-532 area from previous session highs
Volume Analysis:
- Volume surge to 39.3K units (158% above SMA) confirmed breakout validity
- Declining volume during consolidation shows limited distribution pressure
- 60-minute volume of 3,276 units supported momentum testing higher
- Accumulation patterns evident above $515 support zone
Chart Patterns:
- Bullish trend intact with higher lows maintained through consolidation
- Descending channel following breakout suggests controlled profit-taking
- Two-phase movement shows continued institutional interest
- Support testing reinforces structural integrity of uptrend
Targets & Risk Management:
- Immediate target: $521.50 resistance retest with volume confirmation
- Extended objective: Return to $530-532 breakout highs on follow-through
- Risk threshold: Break below $515.00 support signals trend failure
- Stop placement: Conservative exits below $499 support for swing trades
Disclaimer: The content of this article solely reflects the author's opinion and does not represent the platform in any capacity. This article is not intended to serve as a reference for making investment decisions.
You may also like
Why is the Crypto Market Down Today Amid the End of the U.S. Government?
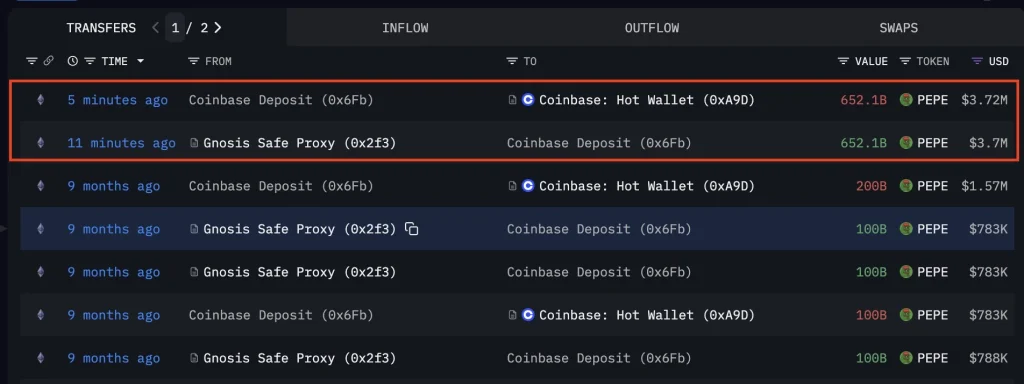
Pepe Price on the Cusp of Further Selloff as Top Whales Capitulate
South Korea’s NH NongHyup Bank Pilots Stablecoin-Based VAT Refunds for Tourists
Will Bitcoin Price Dip Below $100k This Week?