YFI Drops 1.82% Over 24 Hours as Technical Indicators Remain Unstable
- YFI fell 1.82% in 24 hours amid broader bearish sentiment, despite a 10.5% 7-day gain. - Key indicators show long-term bearish bias with falling 50/200-day SMAs and RSI in neutral territory. - Modest OBV improvement hints at potential near-term bottoming, but downward momentum persists via negative MACD. - A backtest using golden cross and RSI triggers aims to capture momentum amid uncertain breakout conditions.
As of November 9, 2025, YFI experienced a 1.82% decline over the past day, settling at $4,810. Over the previous week, YFI climbed by 10.5%, gained 1.53% in the past month, but has fallen 40.21% over the last year.
YFI’s latest pullback points to a prevailing bearish outlook among market participants, even though it has performed well in the short term over the last week. The current price movement indicates a continuation pattern within a turbulent technical landscape. Experts believe the market is at a pivotal stage, where short-term bullish
Major technical signals underscore this struggle. Both the 50-day and 200-day Simple Moving Averages are trending downward, pointing to a persistent bearish trend over the long run. At the same time, the Relative Strength Index (RSI) has recently returned to a neutral range, which may indicate that the recent downward move is losing steam. Nevertheless, the MACD histogram remains in negative territory, showing that bearish momentum is still present.
The on-balance volume (OBV) has seen a slight uptick lately, suggesting some accumulation is taking place. This could be an early sign of a potential short-term bottom. However, since there has not been a decisive move above important resistance levels, buyers appear reluctant to invest at higher prices.
Backtest Hypothesis
To assess how well a trading strategy might perform under these technical conditions, a backtest could be run using a mix of moving average crossovers and RSI thresholds for trade entries and exits. For example, a long position could be initiated when the 50-day SMA crosses above the 200-day SMA (a golden cross), while a short position could be opened if the RSI drops below 30. Exits might be determined by a set holding period or a stop-loss at a specific percentage. This strategy seeks to follow the prevailing trend while controlling risk through clear rules.
Disclaimer: The content of this article solely reflects the author's opinion and does not represent the platform in any capacity. This article is not intended to serve as a reference for making investment decisions.
You may also like
Astar 2.0: Is This a Strong Opportunity for Institutional Investors to Enter?
- Astar 2.0 upgrades blockchain scalability via Polkadot's async protocol, cutting block time to 6 seconds and boosting TPS to 150,000. - Institutional adoption grows with $3.16M ASTR purchase, 20% QoQ wallet growth, and partnerships with Sony , Casio, and Japan Airlines. - Cross-chain liquidity via Chainlink CCIP and hybrid architecture position Astar as a bridge between decentralized innovation and enterprise needs. - Analysts project ASTR could reach $0.80–$1.20 by 2030, though liquidity constraints and

Bitcoin Bounces Back as Trump’s $2,000 Dividend Plan and Michael Saylor’s Hint Spark Market Optimism
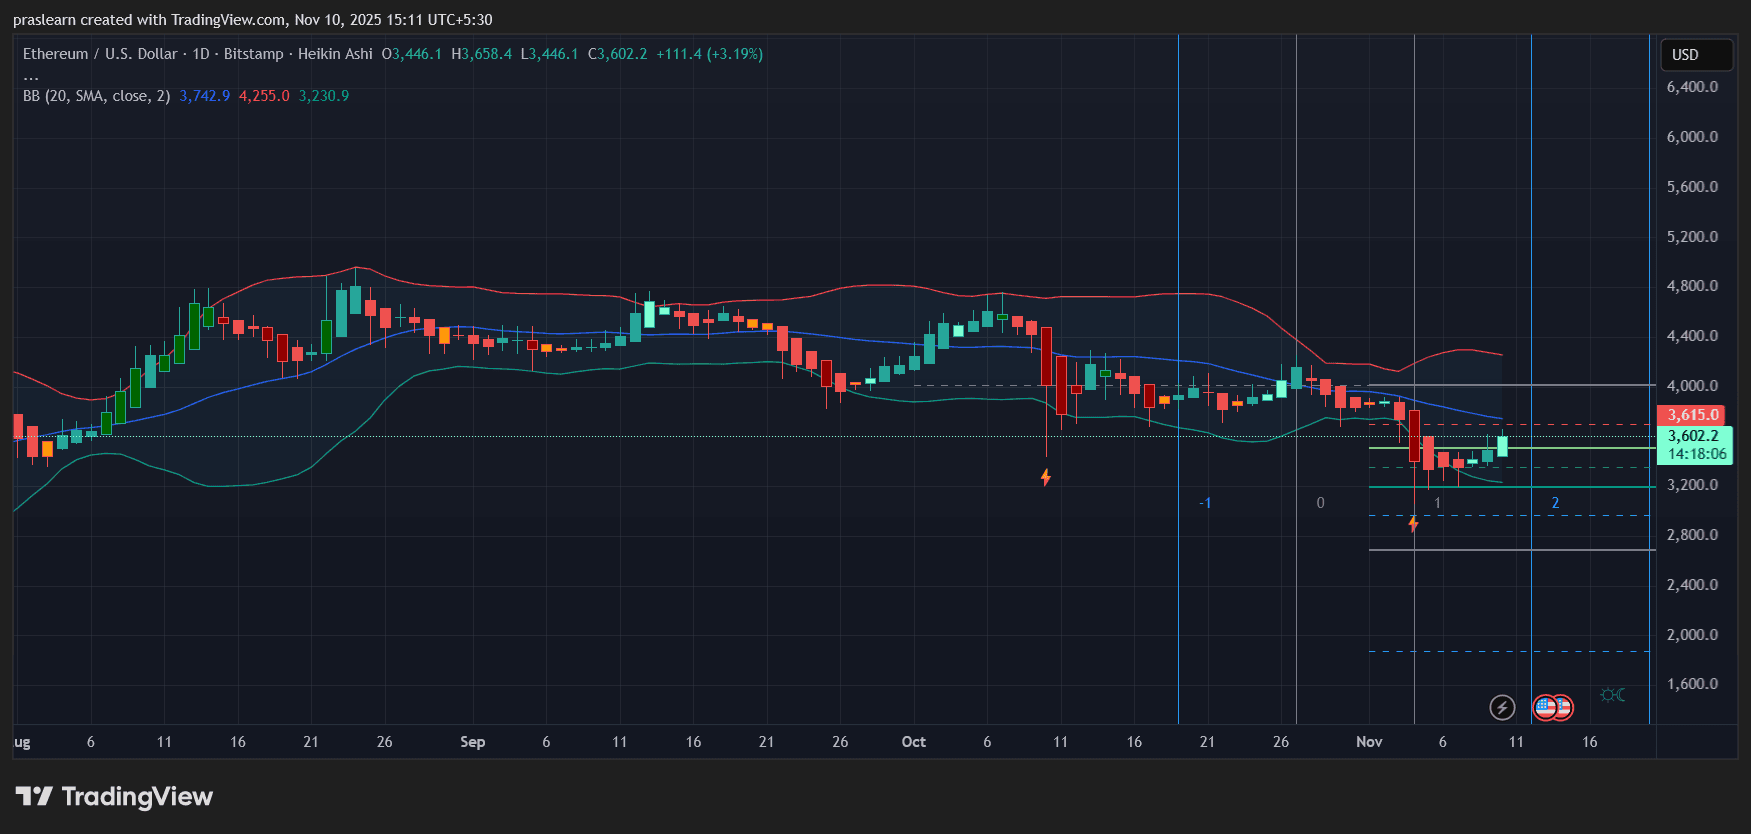
Will Political Calm Push ETH Price Toward $4,000?
Vitalik Buterin's Latest Advocacy for ZK Technology in Ethereum: Evaluating the Impact of ZK on Ethereum's Future Scalability and Investment Potential
- Vitalik Buterin prioritizes ZK proofs to enhance Ethereum's scalability, privacy, and quantum resistance amid institutional demand and post-AGI risks. - Ethereum's "Lean Ethereum" upgrades remove modexp precompiles and adopt GKR protocol, boosting TPS and quantum security while temporarily affecting gas fees. - ZK layer 2 solutions like Lighter (24k TPS) and ZKsync (15k TPS) drive institutional adoption, with 83% of enterprise smart contracts now using ZK-rollups. - ZK-driven infrastructure (ZKsync, Star