HBAR’s ETF Buzz Could Be a Late Bloomer As Price Pullback Sets Up The Next Rally

HBAR’s post-ETF drop looks more like a setup than a setback. Despite a brief sell-the-news correction, on-chain data and derivatives activity suggest the rally may just be pausing before its next move, with whales and short sellers setting the stage for a potential rebound.
Hedera’s native token, HBAR, slipped about 4.5% in the 24 hours following the launch of the Canary Capital spot HBAR ETF on October 28. The HBAR price drop looked like a typical sell-the-news reaction with traders locking in profits after last week’s 18% rally.
Still, the ETF’s broader effect may just be delayed. While short-term traders exited early, technical and on-chain data show that the HBAR price pullback could be laying the foundation for another upward move. The ETF buzz might prove to be a late bloomer, with its strongest impact felt once short-term profit-taking clears out.
Head-and-Shoulders Breakout Holds Despite Cooling Momentum
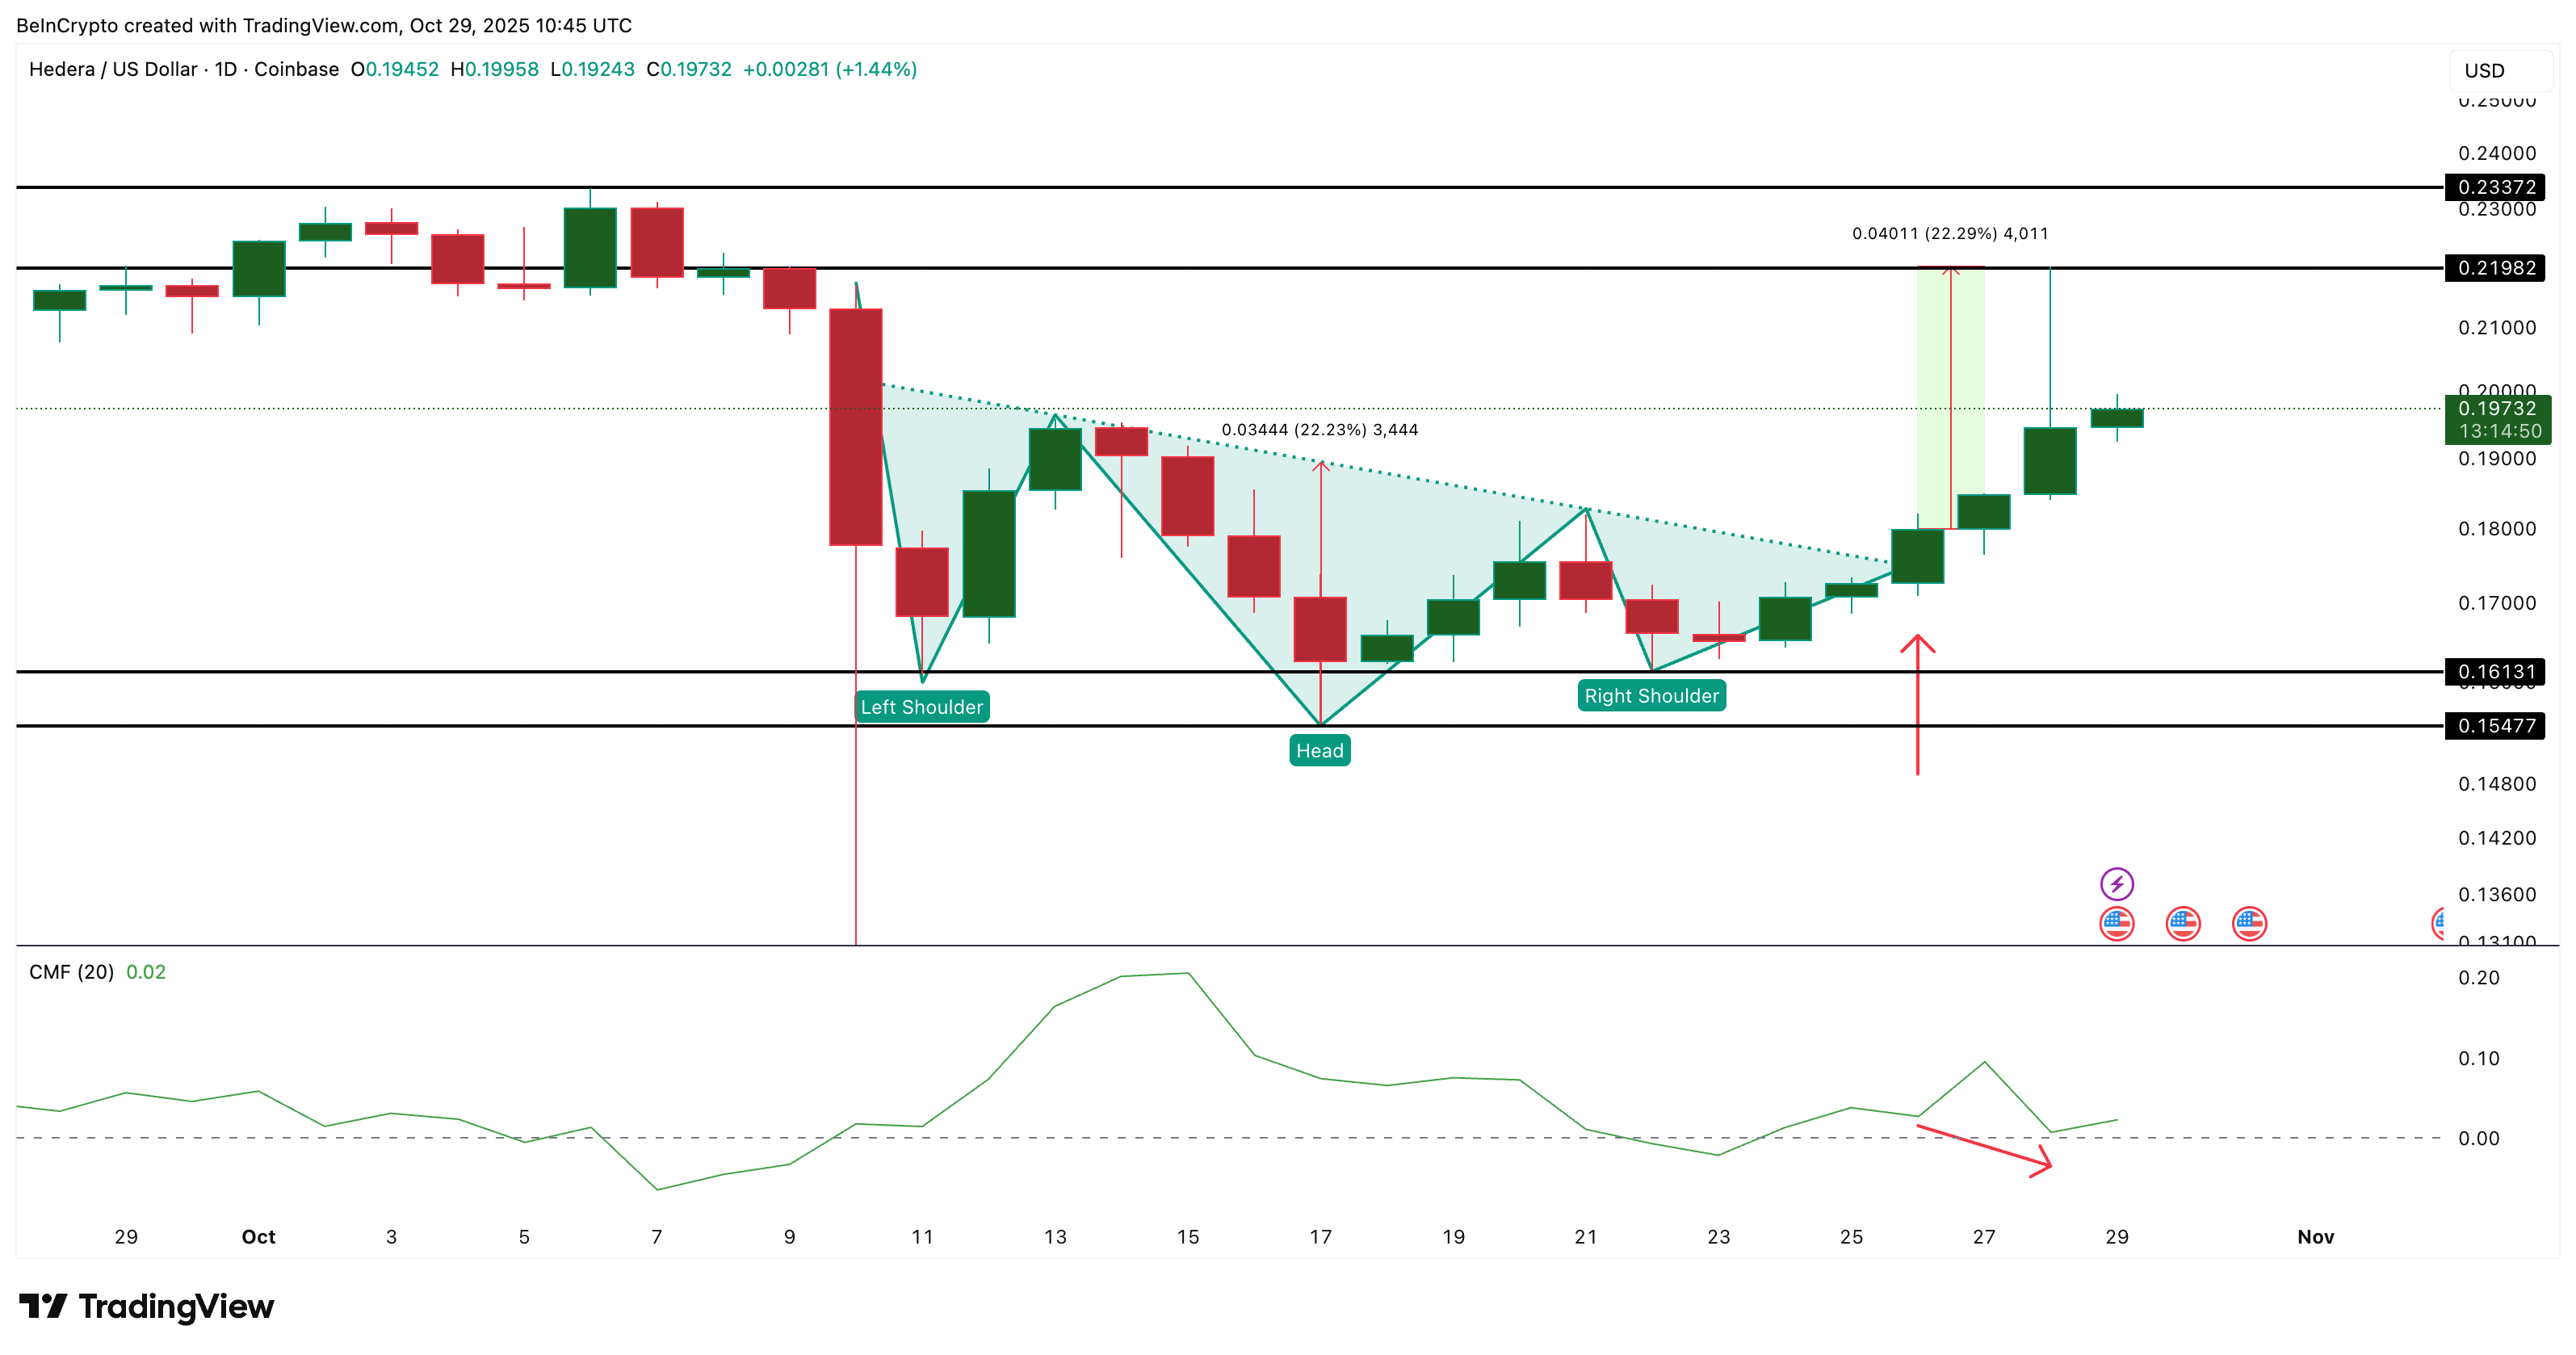
On October 26, HBAR confirmed an inverse head-and-shoulders breakout, a pattern that often marks the start of a new upward phase. From the breakout candle close, HBAR climbed exactly to its projected target near $0.219 before easing back.
That retrace doesn’t invalidate the setup. The formation remains valid as long as HBAR holds above $0.161, which serves as the right shoulder base.
 HBAR Price Pattern:
TradingView
HBAR Price Pattern:
TradingView
Want more token insights like this? Sign up for Editor Harsh Notariya’s Daily Crypto Newsletter.
The Chaikin Money Flow (CMF) supports this structure. This indicator measures large investor inflows and outflows. It stayed above zero even as prices corrected, showing that big buyers took advantage of lower prices to enter, adding fresh support to the base.
The only concern is that CMF has made a slightly lower low, meaning inflows are steady but slowing. So while the HBAR price rally still looks healthy, short pullbacks may continue as new entrants absorb selling pressure.
This renewed pullback-led participation, triggered after the ETF buzz, could prove vital for sustaining the next phase of the rally.
Liquidation Map Points to a Possible Short Squeeze
The derivatives market also reflects this short-term uncertainty around the ETF narrative. Many traders seem to believe the “ETF buzz” has faded after the correction, leading to a heavy buildup of short positions.
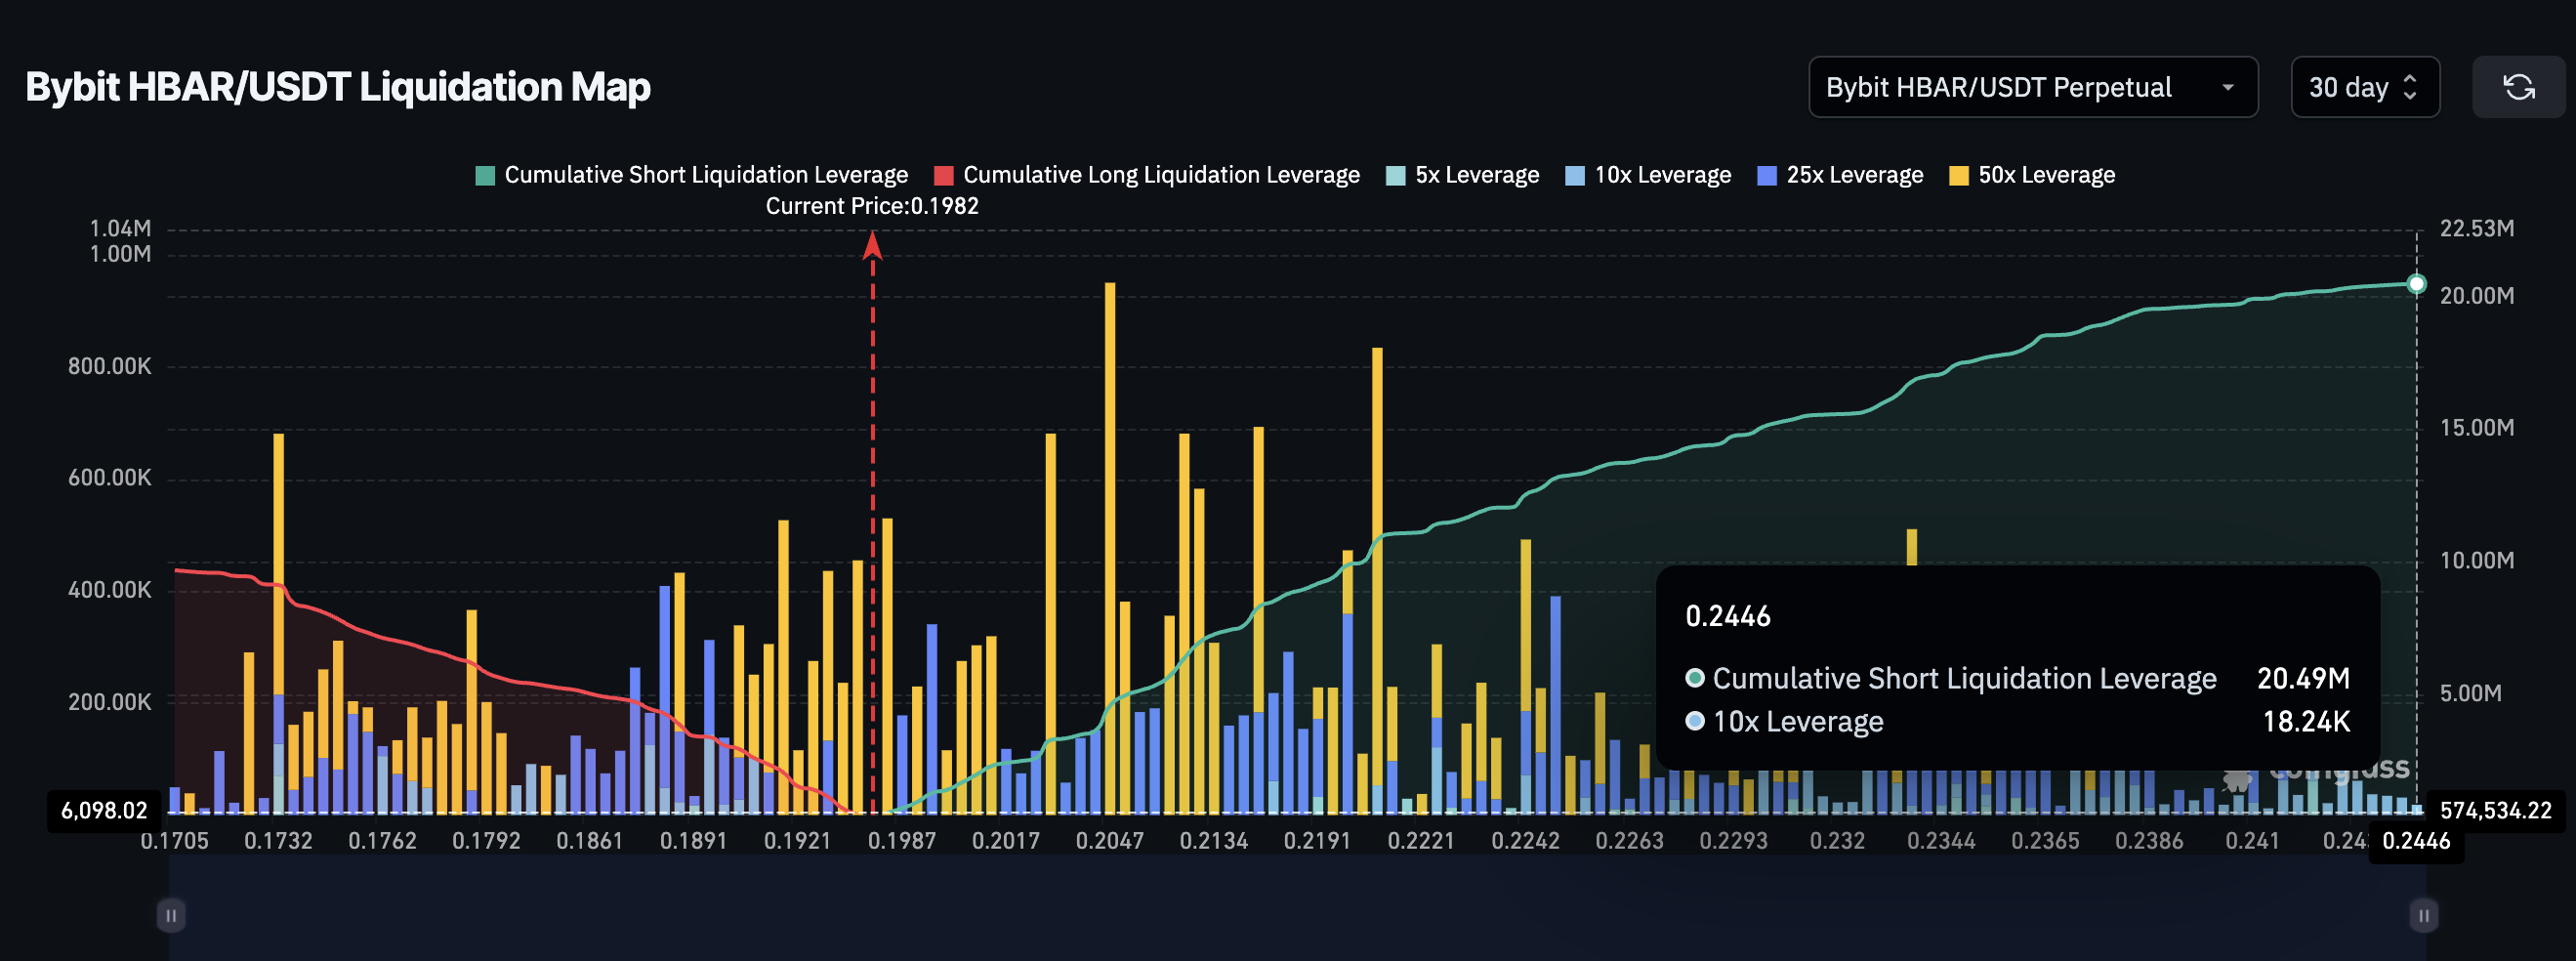
A liquidation map, which shows where leveraged traders might be forced to close positions, highlights this imbalance. On Bybit, short positions outweigh longs by more than 2-to-1, with around 20.49 million USDT in short exposure compared to 9.68 million USDT in longs.
 HBAR Shorts Dominate The Map:
Coinglass
HBAR Shorts Dominate The Map:
Coinglass
The shorts start getting liquidated around $0.198. If HBAR rises above that mark, it could trigger a wave of automatic buy-backs from short traders, a short squeeze, rapidly driving prices higher. Per the chart, most of the shorts would get wiped out if the HBAR price breaches the $0.219 mark.
This setup, combined with renewed buying after the ETF pullback, signals that the post-ETF weakness could be the setup phase before the next leg of the HBAR price rally.
Signs Point to Renewed Strength in the HBAR Price Uptrend
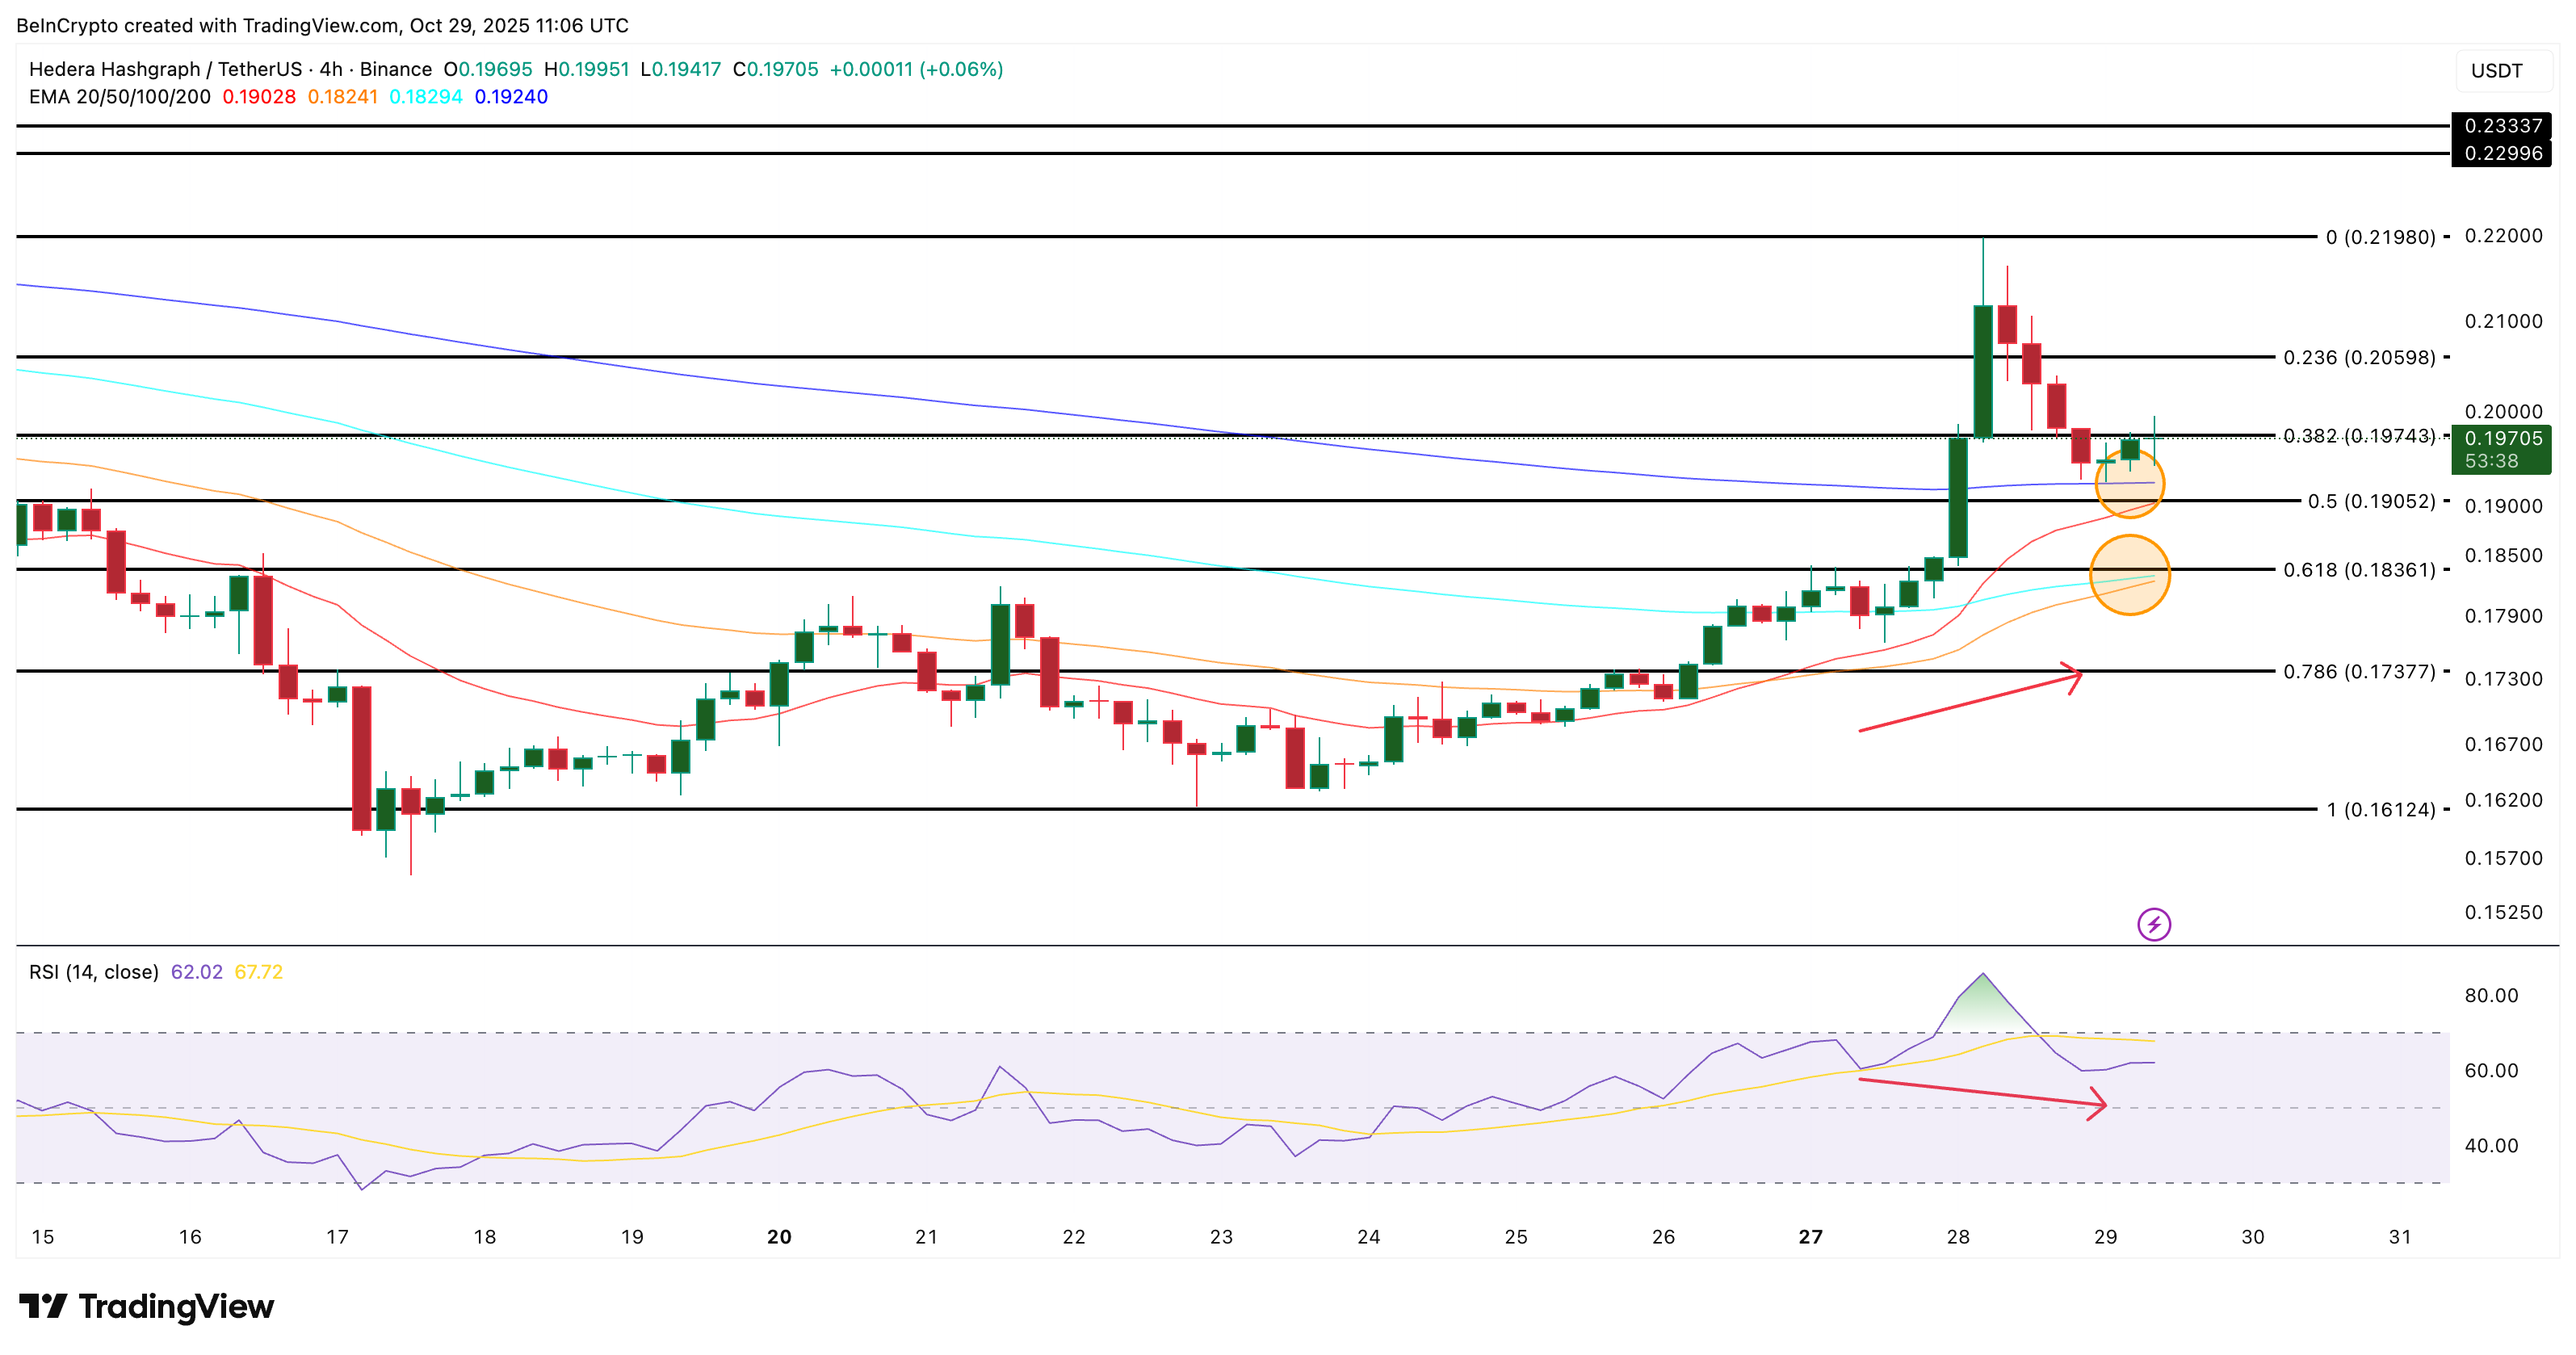
On the 4-hour chart, HBAR’s price structure remains strong. The token trades above key Exponential Moving Averages (EMAs). These indicators smooth the price data to show the overall direction of the trend. The 20 EMA is nearing a crossover above the 200 EMA, while the 50 EMA is closing in on the 100 EMA, both early indicators that momentum is returning.
If and when this “Golden” crossover (s) happens, the HBAR price will most probably rise. Even the smallest surge would start liquidating the shorts, triggering the squeeze setup. That could have a positive cascading effect on the price action.
Meanwhile, the Relative Strength Index (RSI), which measures buying versus selling momentum, flashed a hidden bullish divergence between October 27 and 28. During that period, price made a higher low while RSI made a lower low, confirming that the underlying trend still points upside.
 HBAR Price Analysis:
TradingView
HBAR Price Analysis:
TradingView
HBAR now holds support near $0.197. If buyers defend it, the next upside targets lie at $0.205, $0.219 (last rejection level), and $0.233. However, a fall below $0.190 could weaken the structure and expose $0.173, potentially invalidating the short-term view.
However, the inverse head-and-shoulders chart shared earlier shows that complete trend invalidation occurs only if the HBAR price dips below $0.161.
Disclaimer: The content of this article solely reflects the author's opinion and does not represent the platform in any capacity. This article is not intended to serve as a reference for making investment decisions.
You may also like
Economic Truth: AI Drives Growth Alone, Cryptocurrency Becomes a Political Asset
The article analyzes the current economic situation, pointing out that AI is the main driver of GDP growth, while other sectors such as the labor market and household finances are in decline. Market dynamics have become detached from fundamentals, with AI capital expenditure being key to avoiding a recession. The widening wealth gap and energy supply are becoming bottlenecks for AI development. In the future, AI and cryptocurrencies may become the focus of policy adjustments. Summary generated by Mars AI This summary was generated by the Mars AI model, and its accuracy and completeness are still in the process of iterative improvement.
AI unicorn Anthropic accelerates IPO push, taking on OpenAI head-to-head?
Anthropic is accelerating its expansion into the capital markets, initiating collaboration with top law firms, which is seen as an important signal toward going public. The company's valuation is approaching 300 billions USD, and investors are betting it could go public before OpenAI.
Did top universities also get burned? Harvard invested $500 million heavily in bitcoin right before the major plunge
Harvard University's endowment fund significantly increased its holdings in bitcoin ETFs to nearly 500 million USD in the previous quarter. However, in the current quarter, the price of bitcoin subsequently dropped by more than 20%, exposing the fund to significant timing risk.

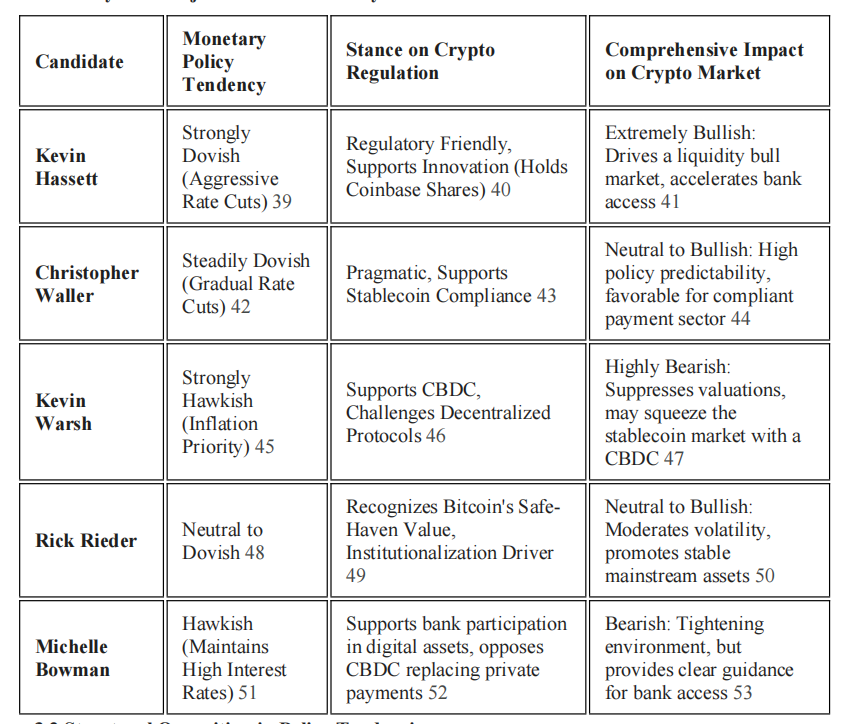
The Structural Impact of the Next Federal Reserve Chair on the Cryptocurrency Industry: Policy Shifts and Regulatory Reshaping
The change of the next Federal Reserve Chair is a decisive factor in reshaping the future macro environment of the cryptocurrency industry.