Date: Sat, Oct 25, 2025 | 09:20 AM GMT
The broader cryptocurrency market is showing steady performance today, with Bitcoin (BTC) and Ethereum (ETH) trading relatively flat. However, select altcoins — including Chainlink (LINK) — are flashing bullish technical setups that could hint at potential upside momentum in the coming sessions.
LINK is in green today with modest gains but more importantly, its latest chart formation is displaying a harmonic structure that could set the stage for further bullish momentum in the days ahead.
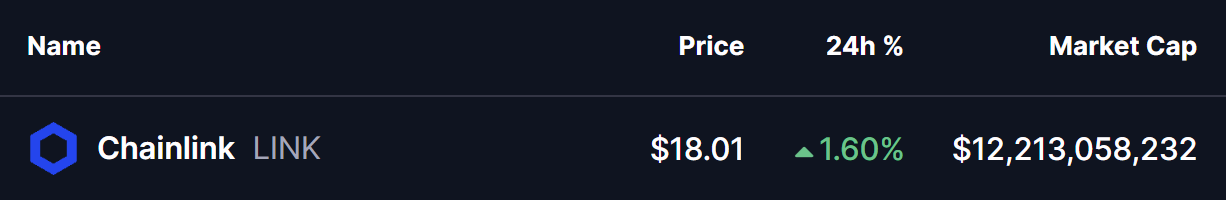 Source: Coinmarketcap
Harmonic Pattern Hints at Potential Upside
On the 4-hour chart, LINK has formed a Bearish Butterfly harmonic pattern — a structure that, despite its name, often witnesses a bullish rally during the CD leg before the price approaches the Potential Reversal Zone (PRZ).
The formation began at Point X ($20.199), followed by a drop to Point A, then a rally to Point B, and finally a retracement to Point C near $16.750. Since then, LINK has shown strong recovery, currently trading around $18.01, and more importantly, has reclaimed its 50-hour moving average ($17.497) — signaling renewed buying interest.
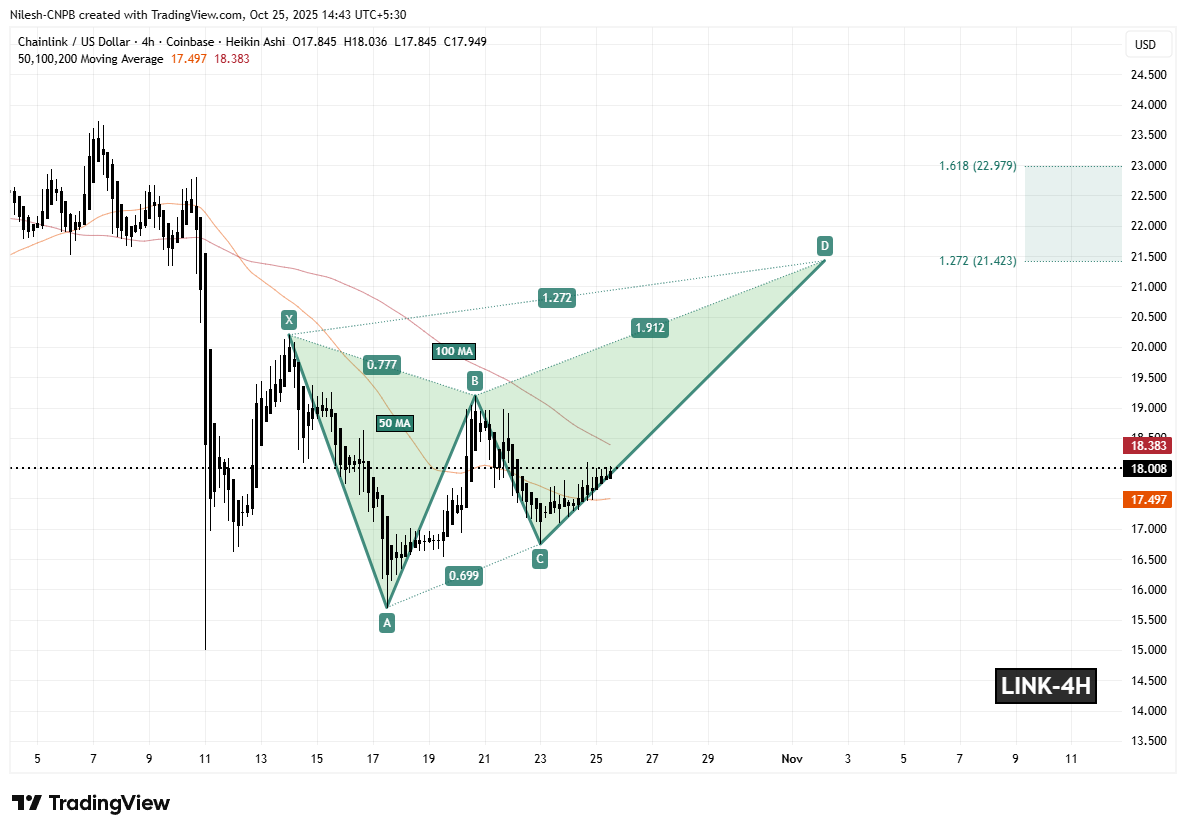 Chainlink (LINK) 4H Chart/Coinsprobe (Source: Tradingview)
The next technical hurdle lies at the 100-hour MA ($18.383). A confirmed breakout above this level would likely validate the continuation of the bullish CD leg, opening the door for a move toward the PRZ.
What’s Next for LINK?
If bulls successfully defend the 50-hour MA and push LINK above the 100-hour MA, the pattern projects an upside target between $21.423 (1.272 Fibonacci extension) and $22.979 (1.618 extension) — representing the key PRZ levels where this harmonic setup typically completes. Such a move would mark a potential 27% rally from current levels.
However, if LINK fails to maintain support at the 50-hour MA, the bullish structure could weaken, leading to a short-term consolidation phase before any renewed attempt to reclaim higher levels.