Date: Wed, Oct 22, 2025 | 06:40 AM GMT
The cryptocurrency market continues to display its characteristic volatility, with total 24-hour liquidations reaching $652 million. Of that, $352 million came from long positions while $300 million in shorts were wiped out — showing that traders on both sides are facing pressure amid the market’s choppy conditions.
Amid this turbulence, Solana (SOL) has slipped into red territory, retreating to around $184 after touching a 24-hour high of $197. Technical signals on the lower timeframe are now hinting at a potential short-term pullback before any new upside attempt.
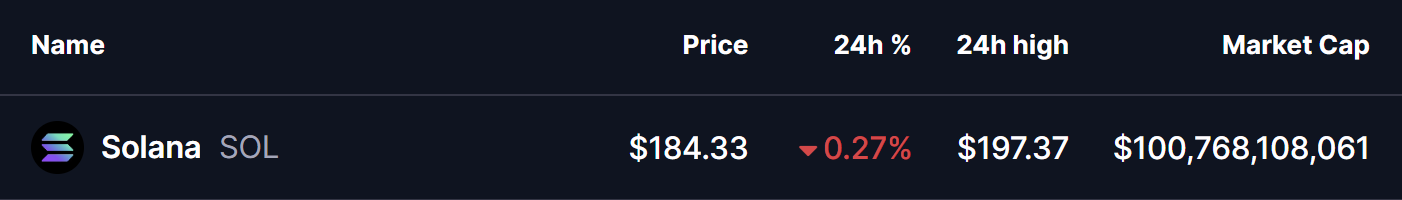 Source: Coinmarketcap
Descending Triangle Pattern in Play?
On the 4-hour chart, SOL appears to be consolidating within a descending triangle pattern, a formation that typically suggests bearish continuation if the support base fails to hold.
The structure shows a series of lower highs, indicating growing selling pressure, pressing down against a horizontal support level. The most recent rejection from the descending trendline near $197.71 has driven prices lower toward $184.37, where sellers seem to be gaining control.
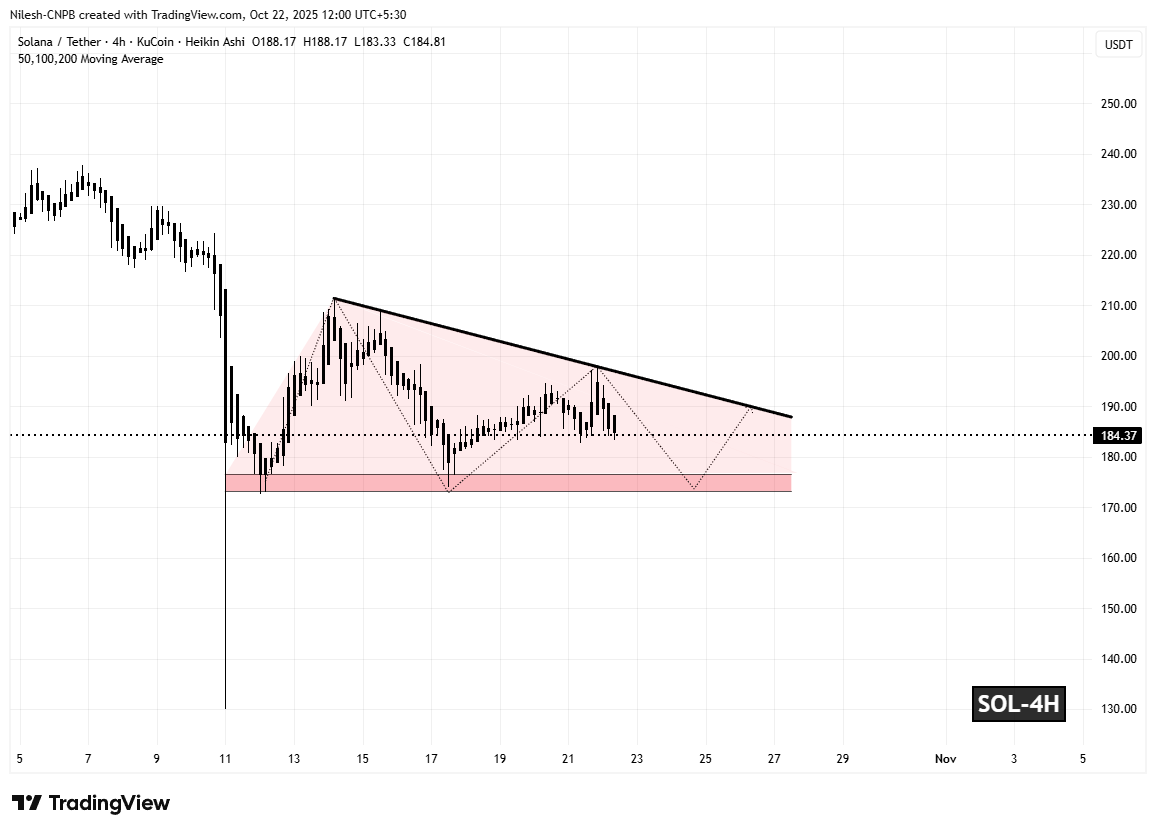 Solana (SOL) 4H Chart/Coinsprobe (Source: Tradingview)
What’s Next for SOL?
If downside pressure continues, a break below the $182.78 support range could push SOL toward its next key zone near $174, representing roughly a 5% decline from current levels. Such a move would align with the lower boundary of the descending triangle and could put additional strain on the broader altcoin market.
However, if bulls successfully defend the $182.78 support zone, SOL could continue consolidating before attempting another breakout toward the descending trendline. A confirmed breakout above that level would invalidate the bearish setup and potentially reignite bullish momentum toward higher targets.