
BNB News Today: Is the $1,000 Level a Safety Net for BNB or Could It Trigger a 30% Drop?
- Binance Coin (BNB) faces potential 25-30% correction as technical indicators and overbought conditions signal a pullback to $835–$900. - A $19B liquidation event at Binance, caused by mispriced collateral, triggered a crisis despite a $400M compensation pledge. - BNB Chain user activity dropped 57% since September, while RSI at 75.79 highlights weakening momentum amid bearish divergence. - U.S.-China trade tensions and a $500B crypto crash accelerated BNB's 10% 24-hour decline, with altcoins bearing disp
Binance Coin (BNB) is under increasing strain as recent market swings and technical signals point to a possible 25-30% drop in the near future. After reaching an all-time high of $1,300 in early October, BNB has slipped to around $1,150. Analysts highlight overbought signals and deteriorating fundamentals as major concerns. A double-top pattern on the daily chart, along with a decrease in user engagement on the
The recent sell-off was triggered by a $19 billion liquidation at Binance, caused by inaccurately valued collateral such as
Technical analysis adds to the negative outlook. BNB’s Relative Strength Index (RSI) has surged to 75.79, entering overbought territory that has previously led to sharp corrections. The divergence between rising prices and falling RSI readings points to fading momentum, while a double-top on the four-hour chart suggests a move back to $1,000. Analysts such as Saint on X warn that “if these patterns persist, price corrections are probable,” noting that support between $730 and $860 could be crucial for the next market phase.
Broader economic factors are also increasing the risks. Escalating trade disputes between the U.S. and China—including Trump’s proposal for a 100% tariff on Chinese goods—sparked a wider crypto sell-off, with BNB dropping 10% in a single day. The flash crash on October 10 wiped out $500 billion in market value, and altcoins like BNB suffered particularly steep losses. “Altcoins took significant technical hits,” said Charlie Erith of Wiston Capital, as bitcoin’s market share grew during the chaos.
Despite the challenges, some long-term investors remain cautiously hopeful. A bull flag pattern on BNB’s monthly chart hints at a possible rally to $2,100 if the $1,000 support level is maintained. Forecasts from Crypto News and Binance Square suggest BNB could reach $1,226 by the end of 2025 and $2,410 by 2030, fueled by Binance’s expanding ecosystem and deflationary token model. Upcoming upgrades, such as the Maxwell protocol—which will cut block times to 0.5 seconds—are also expected to boost adoption.
The short-term direction depends on key support levels. If BNB falls below $1,000, the decline could accelerate toward $835, confirming the double-top scenario. On the other hand, a move above $1,192—the current major resistance—could restart the upward trend. Experts emphasize the need for Binance to maintain stability after the liquidation event and for greater macroeconomic certainty, especially ahead of the Fed’s October interest rate decision.
Disclaimer: The content of this article solely reflects the author's opinion and does not represent the platform in any capacity. This article is not intended to serve as a reference for making investment decisions.
You may also like
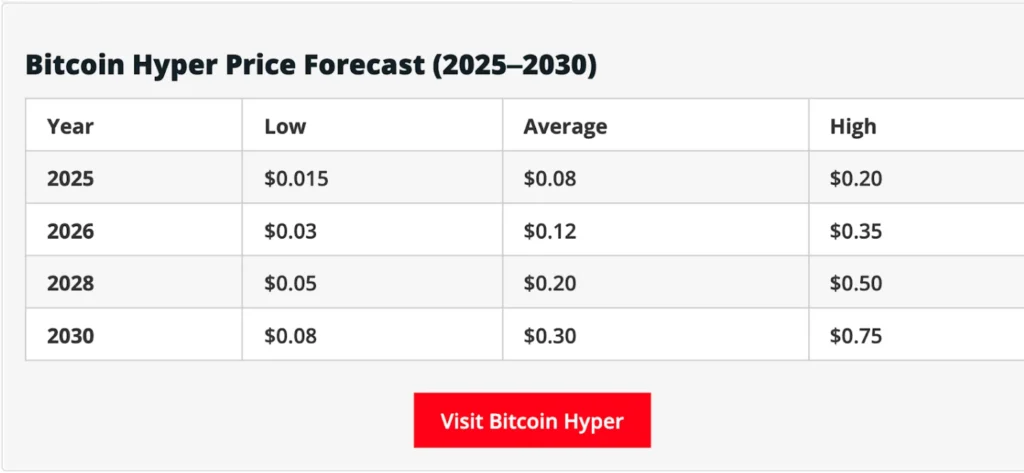
Bitcoin Hyper Price Prediction 2030: Fed Opens Banking Doors as DeepSnitch AI Prepares to Dominate the Market in Weeks
CryptoAppsy Elevates Your Crypto Experience
Local Voices and KOLs Now Steer Asia’s Crypto Narrative, Not Global Mastheads
XRP Price Holds Steady as Support at $1.88 Drives Controlled Rebound