As per its historical October trend, the cryptocurrency market is showing strong upside momentum, with Bitcoin (BTC) and Ethereum (ETH) surging over 9% and 12% respectively in the past week. Riding this market-wide strength, several major altcoins are beginning to display bullish setups — and Chainlink (LINK) is one of the most notable among them.
LINK is up by 8% this week, but what’s grabbing attention is a fractal pattern forming on the chart that closely resembles its June–July breakout structure, which preceded a massive rally earlier this year.
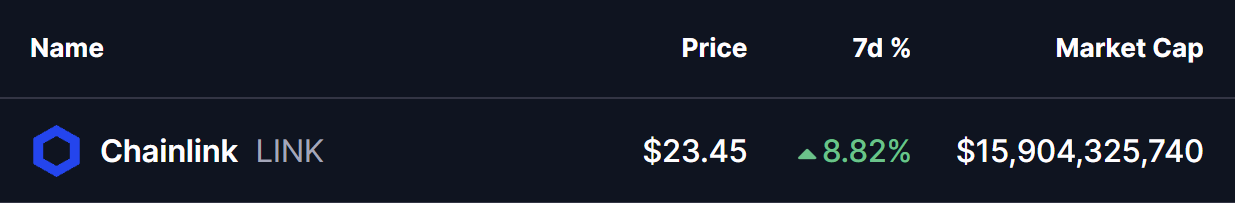 Source: Coinmarketcap
Fractal Setup Hints at a Bullish Move
On the daily chart, LINK is tracing out a setup strikingly similar to its June–July bullish fractal.
Back then, LINK broke out of a descending channel while the RSI simultaneously broke above resistance and the token reclaimed its 50-day moving average (MA). That technical alignment triggered a powerful 100% rally, propelling LINK from around $13 to over $27 within weeks.
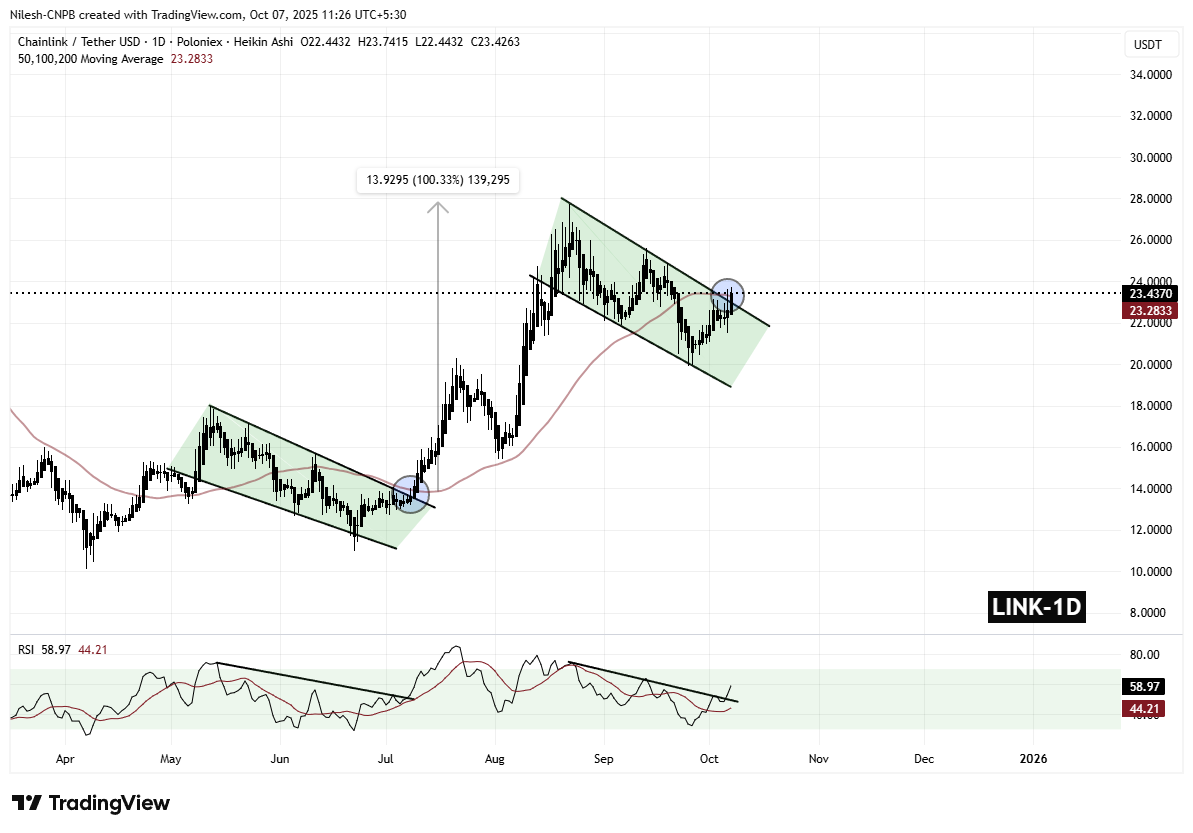 Chainlink (LINK) Daily Chart/Coinsprobe (Source: Tradingview)
Now, history seems to be repeating itself. LINK has once again formed a descending channel, completed a bullish RSI breakout, and has just reclaimed the 50-day MA at $23.28, currently trading slightly above it at $23.43.
This confluence of signals — the RSI breakout, price action above the 50-day MA, and the mirror fractal — all point toward a potential bullish continuation.
What’s Next for LINK?
If this fractal setup plays out as before, a successful hold above the 50-day MA and breakout trendline could ignite another strong leg higher. In such a scenario, LINK may target the $27.72 zone in the coming weeks — roughly an 18% upside from current levels.
The resemblance between the current and previous breakout structures makes this a crucial juncture for LINK. Should momentum continue to build, it could mark the start of another major rally, much like the one that unfolded earlier this year.