Cardano price is under short-term bearish pressure around $0.85, but broader cycle and Fibonacci analysis suggest an early bullish phase; a close above $1.15 would confirm upward continuation while losing $0.85 risks a retest near $0.63.
-
Short-term support at $0.85; resistance at $0.89–$0.90.
-
TD Sequential now hints at a potential buy setup despite recent 4-hour bearish momentum.
-
Fibonacci cycle comparison points to $1.15 confirmation and extension targets above $3 based on prior structure.
Cardano price outlook: ADA at $0.87 facing short-term bearish pressure with early bullish cycle signals — check levels and next steps.
Cardano shows mixed signals as short term charts trend bearish while cycle analysis points to a potential early bullish phase.
- Cardano dropped to $0.8518 on the 4 hour chart, with support at $0.85–$0.852 and resistance near $0.89–$0.90.
- Analyst Ali’s TD Sequential reading now suggests a potential buy setup despite recent short term bearish momentum.
- Long term Fibonacci analysis compares current structure to 2020, with resistance at $1.15 and extension targets above $3.
Summary: Cardano has renewed strength after fresh technical readings showed opposing short-term and long-term signals. Analyst Ali stated that the TD Sequential indicator, after flagging a prior top, now suggests conditions are shifting toward a potential buy setup.
What is the current Cardano price outlook?
Cardano price is trading near $0.87 with immediate support at $0.85 and resistance at $0.89–$0.90. Short-term momentum on the 4-hour chart is bearish, but cycle-based Fibonacci analysis and TD Sequential readings present an early bullish setup that requires a confirmed close above $1.15.
How is the 4-hour chart shaping ADA’s short-term trend?
On the 4-hour chart ADA formed lower highs and lower lows, with a notable wick to $0.8518 and a close at $0.8611. Volume contraction and a downward-sloping moving average reinforced negative momentum. A decisive close below $0.85 would confirm continuation; a rally above $0.90 with volume would neutralize the bearish bias.
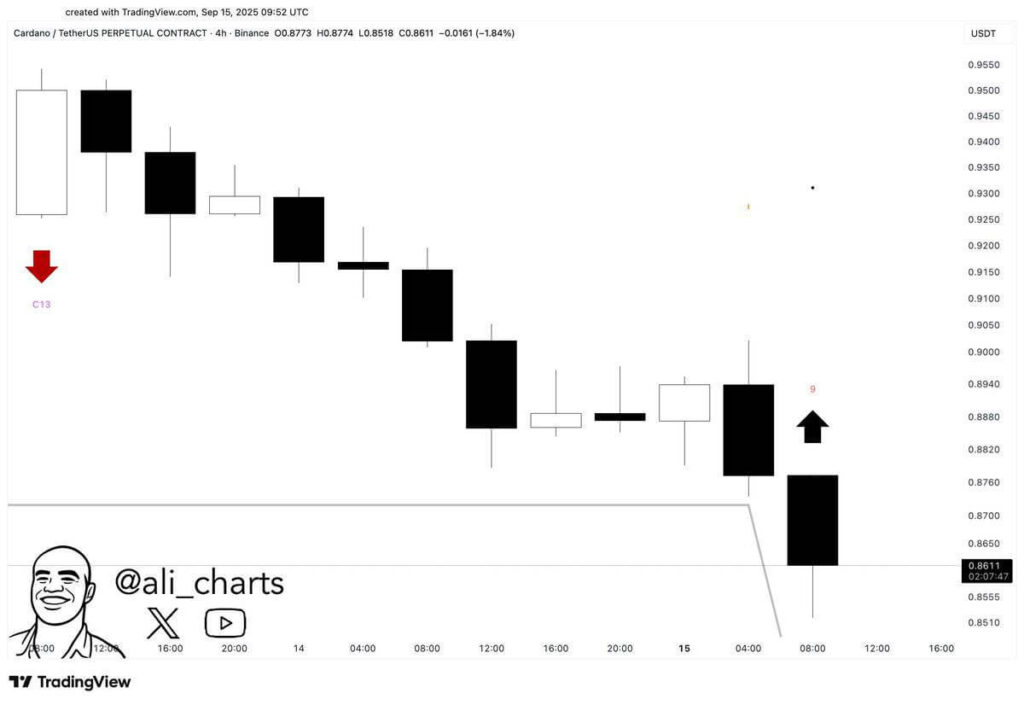
ADA/USDT 4-hour price chart, Source: Ali on X
Why does TD Sequential suggest a potential buy setup?
Analyst Ali’s TD Sequential flipped from signaling a market top to showing setup conditions that can precede a short-covering or reversal. The indicator reads as a potential buy when sequential counts complete and price stabilizes, especially near structural support ($0.85). Confirmation requires bullish price action and volume.
What do Fibonacci cycle comparisons indicate for ADA?
Long-term Fibonacci mapping compares ADA’s 2018–2021 cycle to the 2023–2025 structure. Historically, a break above the 0.5 retracement preceded a multi-dollar rally. Current retracement targets include 0.618 at ~$1.15694 and 0.786 near $1.78464; extensions from prior cycles point to multi-dollar targets above $3 if momentum resumes.
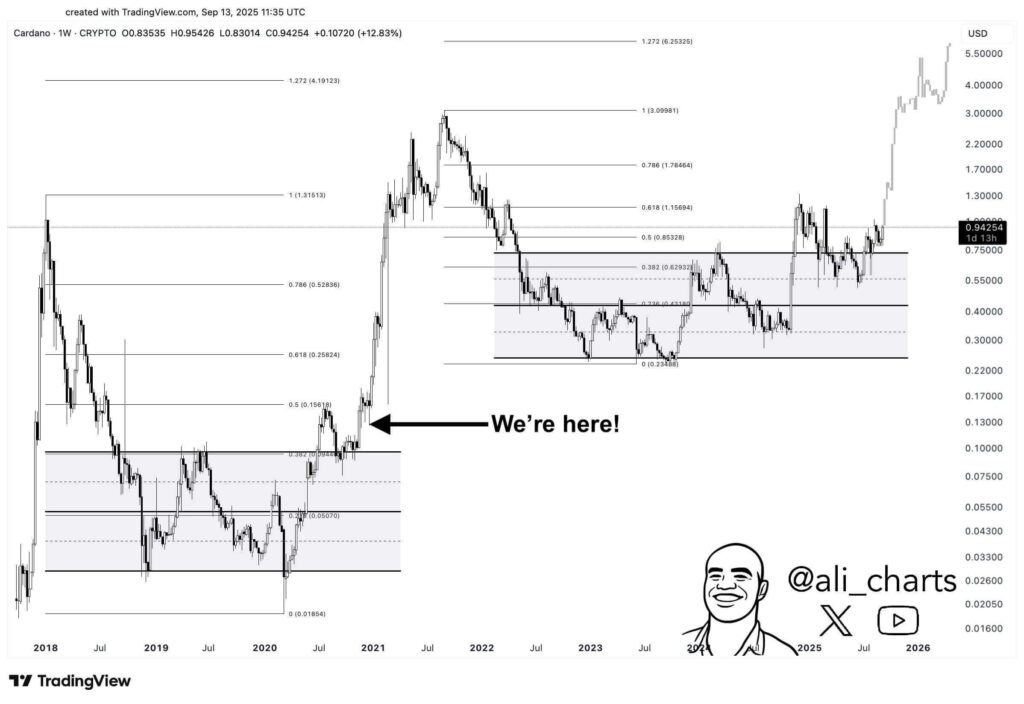
Cardano 1-week price chart, Source: Ali on X
Frequently Asked Questions
What are the critical support and resistance levels for ADA?
Immediate support sits between $0.85 and $0.852; a break below opens a retest of $0.63. Resistance is near $0.89–$0.90, with meaningful bullish confirmation above $1.15 (0.618 Fibonacci retracement).
How should traders use volume and higher-timeframe structure?
Use rising volume to confirm breakouts above resistance or trend reversals. Higher-timeframe structure—weekly and monthly charts—helps validate whether a 4-hour setup is a corrective pullback or a genuine trend change.
Key Takeaways
- Short-term bias: ADA faces bearish pressure on 4-hour, with urgent support at $0.85.
- Setup signals: TD Sequential indicates a potential local buy setup if price stabilizes and volume improves.
- Cycle confirmation: A close above $1.15 would increase odds of a sustained bullish phase with long-term Fibonacci targets above $3.
Conclusion
Cardano price action presents a mixed picture: short-term charts favor sellers while cycle-level Fibonacci and TD Sequential readings hint at early-stage bullish potential. Traders should watch $0.85 for failure and $1.15 for confirmation. COINOTAG will continue monitoring price, volume and structure for updates.