Bitcoin's Fate Tied To RSI Support Level

Driven by euphoria and records beyond $124,000, bitcoin seemed out of reach. However, the sudden break of a major technical support, a pillar of the uptrend, disrupts this picture. False alarm or real reversal signal? The question divides analysts and investors, at a time when certainties waver and volatility returns.
In brief
- Bitcoin has dropped 13.75 % since its record at $124,500, breaking a multi-year technical support.
- Historically, the joint loss of the parabolic support and the RSI has always triggered major corrections.
- If the RSI breaks, BTC price could slide to $80,000 by the end of this year.
- Some analysts believe this is a false breakout aimed at trapping investors.
A technically significant breakout
In the last week of August, bitcoin recorded a sharp drop of more than 13.75 % from its historic peak above $124,000 , thus breaking a multi-year uptrend line that had supported its rally for over two years.
This technical break revived fears of a market reversal among many investors, especially since the RSI (Relative Strength Index), although still in the support zone, also seems under pressure. Historically, it has been the simultaneous loss of the parabolic curve and the RSI that preceded bitcoin’s worst corrections.
Here are the key facts mentioned in the analysis :
- In 2013, bitcoin fell from $1,150 to $150, a drop of -85 %, after losing its parabolic and RSI supports simultaneously ;
- In 2017, a similar dynamic caused a drop from $20,000 to $3,100, or -84 % ;
- In 2021, the bursting of the bubble led to a fall from $69,000 to $15,500, equivalent to -77 %.
The analyst reminds that if the RSI also breaks its support, bitcoin could plunge toward the bi-weekly 50-period exponential moving average (EMA-50-2W), currently around $80,000.
No technical signal yet rules out this scenario. However, at this stage, the market enters a critical testing phase, where any break could accelerate the corrective momentum.
A deliberate false breakout to shake up the markets?
For several leading analysts, this breakout could still be a trap. This is notably the thesis defended by BitBull, which describes the current situation as probable market manipulation aimed at scaring overly nervous investors.
“Even a wick of capitulation below $100,000 would correspond to bitcoin’s historical behavior, which consists of ejecting weak hands before a strong rebound”, he said. In his view, this drop could thus be interpreted as an accumulation opportunity rather than a cycle end signal.
This interpretation is shared by analyst SuperBro, who relies on the Pi Cycle Top model, known for correctly identifying the peaks of the 2013, 2017, and 2021 bull cycles. This model is based on the crossing of two moving averages: the 111SMA (simple moving average over 111 days) and twice the 350SMA.
According to SuperBro, “no Pi Cycle crossover has yet occurred, which indicates the cycle peak has not yet been reached”. He concludes that bitcoin could climb to $280,000 before entering a true reversal phase. In his view, the current $80,000 to $100,000 zone is therefore a strategic reload zone, not a red alert.
Even though the Pi Cycle Top has not yet given a peak signal, it does not exclude intermediate correction phases. Moreover, the current market structure is influenced by macroeconomic, regulatory, and geopolitical factors that are not included in technical models.
If the RSI breaks its support line, a new bearish sequence could be triggered quickly, invalidating the most bullish short-term scenarios. Conversely, a quick rebound above $114,000 , a level identified as critical by several traders, could invalidate this false breakout and restore BTC to its long-term uptrend.
Disclaimer: The content of this article solely reflects the author's opinion and does not represent the platform in any capacity. This article is not intended to serve as a reference for making investment decisions.
You may also like
Economic Truth: AI Drives Growth Alone, Cryptocurrency Becomes a Political Asset
The article analyzes the current economic situation, pointing out that AI is the main driver of GDP growth, while other sectors such as the labor market and household finances are in decline. Market dynamics have become detached from fundamentals, with AI capital expenditure being key to avoiding a recession. The widening wealth gap and energy supply are becoming bottlenecks for AI development. In the future, AI and cryptocurrencies may become the focus of policy adjustments. Summary generated by Mars AI This summary was generated by the Mars AI model, and its accuracy and completeness are still in the process of iterative improvement.

AI unicorn Anthropic accelerates IPO push, taking on OpenAI head-to-head?
Anthropic is accelerating its expansion into the capital markets, initiating collaboration with top law firms, which is seen as an important signal toward going public. The company's valuation is approaching 300 billions USD, and investors are betting it could go public before OpenAI.
Did top universities also get burned? Harvard invested $500 million heavily in bitcoin right before the major plunge
Harvard University's endowment fund significantly increased its holdings in bitcoin ETFs to nearly 500 million USD in the previous quarter. However, in the current quarter, the price of bitcoin subsequently dropped by more than 20%, exposing the fund to significant timing risk.

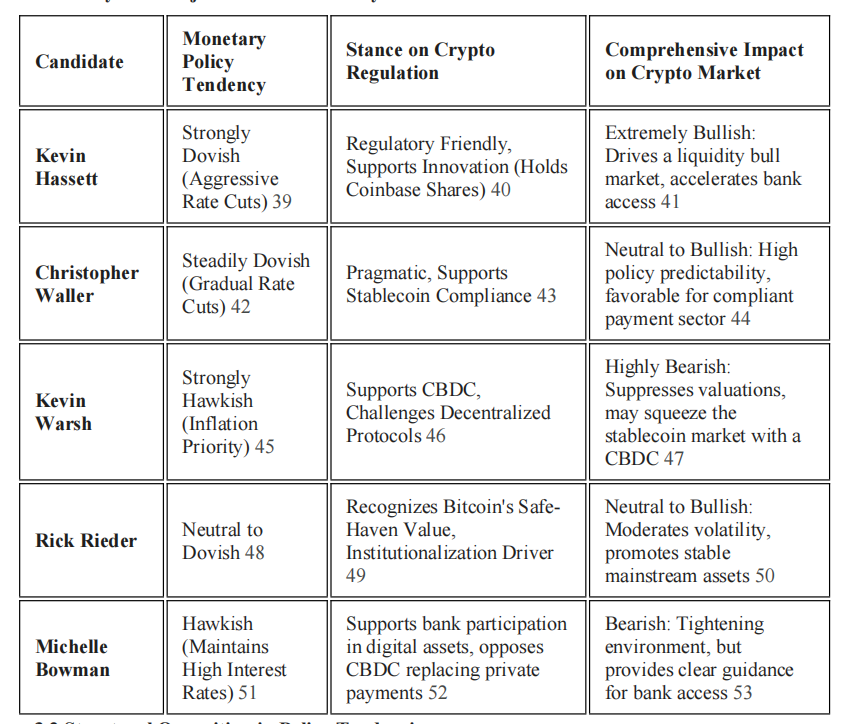
The Structural Impact of the Next Federal Reserve Chair on the Cryptocurrency Industry: Policy Shifts and Regulatory Reshaping
The change of the next Federal Reserve Chair is a decisive factor in reshaping the future macro environment of the cryptocurrency industry.