Bitget App
Trade smarter
Buy cryptoMarketsTradeFuturesEarnWeb3SquareMore
Trade
Spot
Buy and sell crypto with ease
Margin
Amplify your capital and maximize fund efficiency
Onchain
Going Onchain, without going Onchain!
Convert
Zero fees, no slippage
Explore
Launchhub
Gain the edge early and start winning
Copy
Copy elite trader with one click
Bots
Simple, fast, and reliable AI trading bot
Trade
USDT-M Futures
Futures settled in USDT
USDC-M Futures
Futures settled in USDC
Coin-M Futures
Futures settled in cryptocurrencies
Explore
Futures guide
A beginner-to-advanced journey in futures trading
Futures promotions
Generous rewards await
Overview
A variety of products to grow your assets
Simple Earn
Deposit and withdraw anytime to earn flexible returns with zero risk
On-chain Earn
Earn profits daily without risking principal
Structured Earn
Robust financial innovation to navigate market swings
VIP and Wealth Management
Premium services for smart wealth management
Loans
Flexible borrowing with high fund security
SHIB Could Reach $0.00001250–$0.00001270 on Break, or Fall Toward $0.00001160 if $0.000012 Support Fails

SHIB Could Reach $0.00001250–$0.00001270 on Break, or Fall Toward $0.00001160 if $0.000012 Support Fails

CoinotagCoinotag2025/08/30 14:35
By:Marisol Navaro

  • SHIB price up 1.4% in 24 hours, trading at $0.00001240

  • Short-term chart shows bullish bias; mid-term structure favors support near $0.00001160

  • Low trading volume signals limited likelihood of sharp moves next week (source: CoinStats, TradingView)

SHIB price update: SHIB trades at $0.00001240; watch $0.00001250 resistance and $0.00001160 support — read the latest analysis from COINOTAG.


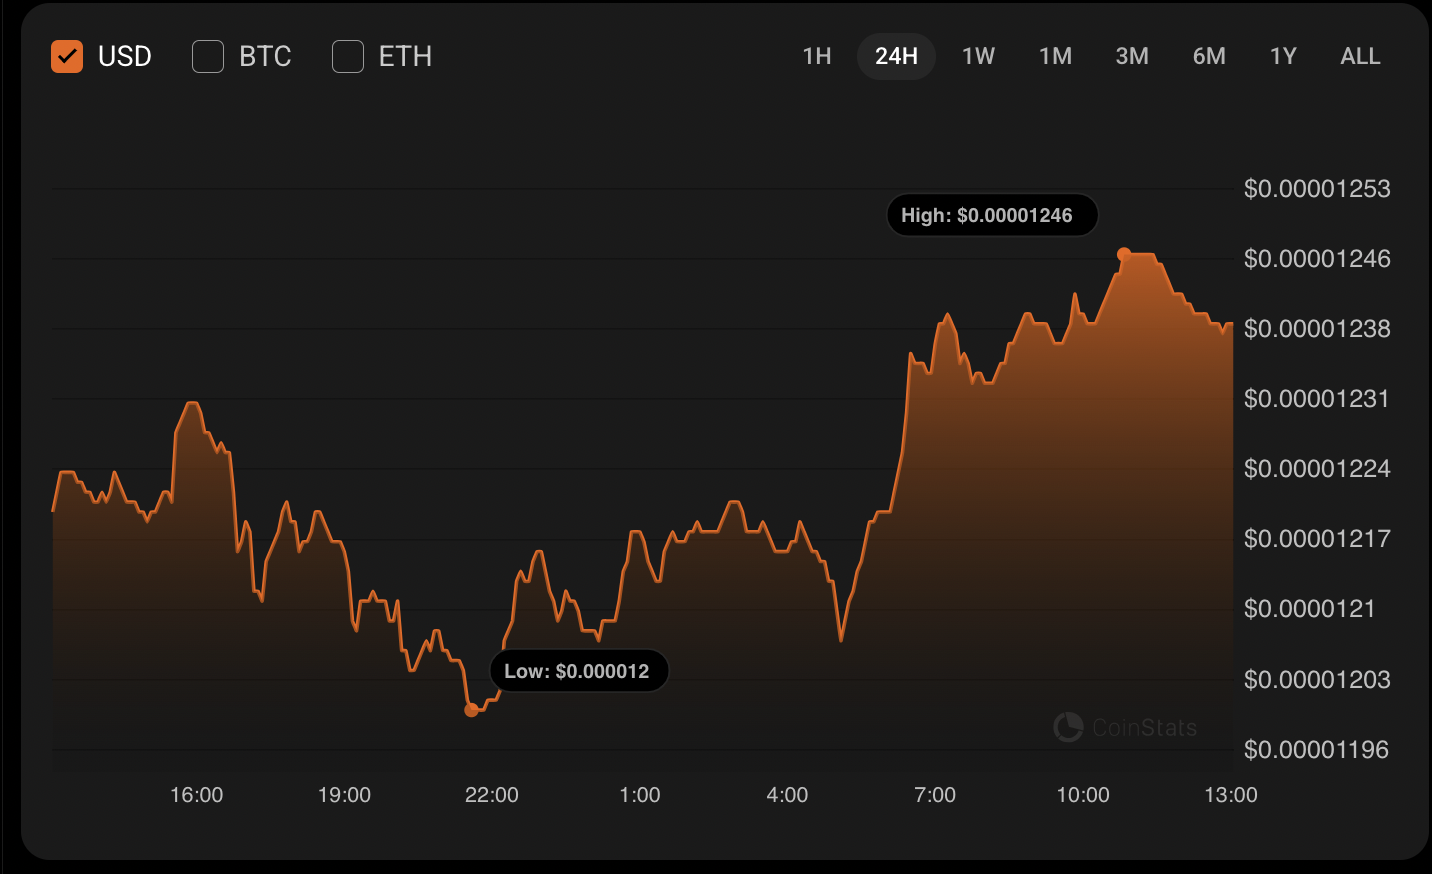
Neither bulls nor bears are controlling the situation on the market on the first day of the weekend, according to CoinStats. Market participants show caution as volume remains subdued.
SHIB Could Reach $0.00001250–$0.00001270 on Break, or Fall Toward $0.00001160 if $0.000012 Support Fails image 0 SHIB chart by CoinStats

What is the current SHIB price and short-term outlook?

SHIB price is trading at $0.00001240 and registered a 1.4% gain over the last 24 hours. The hourly chart displays bullish signals, but the midterm structure remains closer to support than resistance.

How is the SHIB/USD chart shaping the short-term trend?

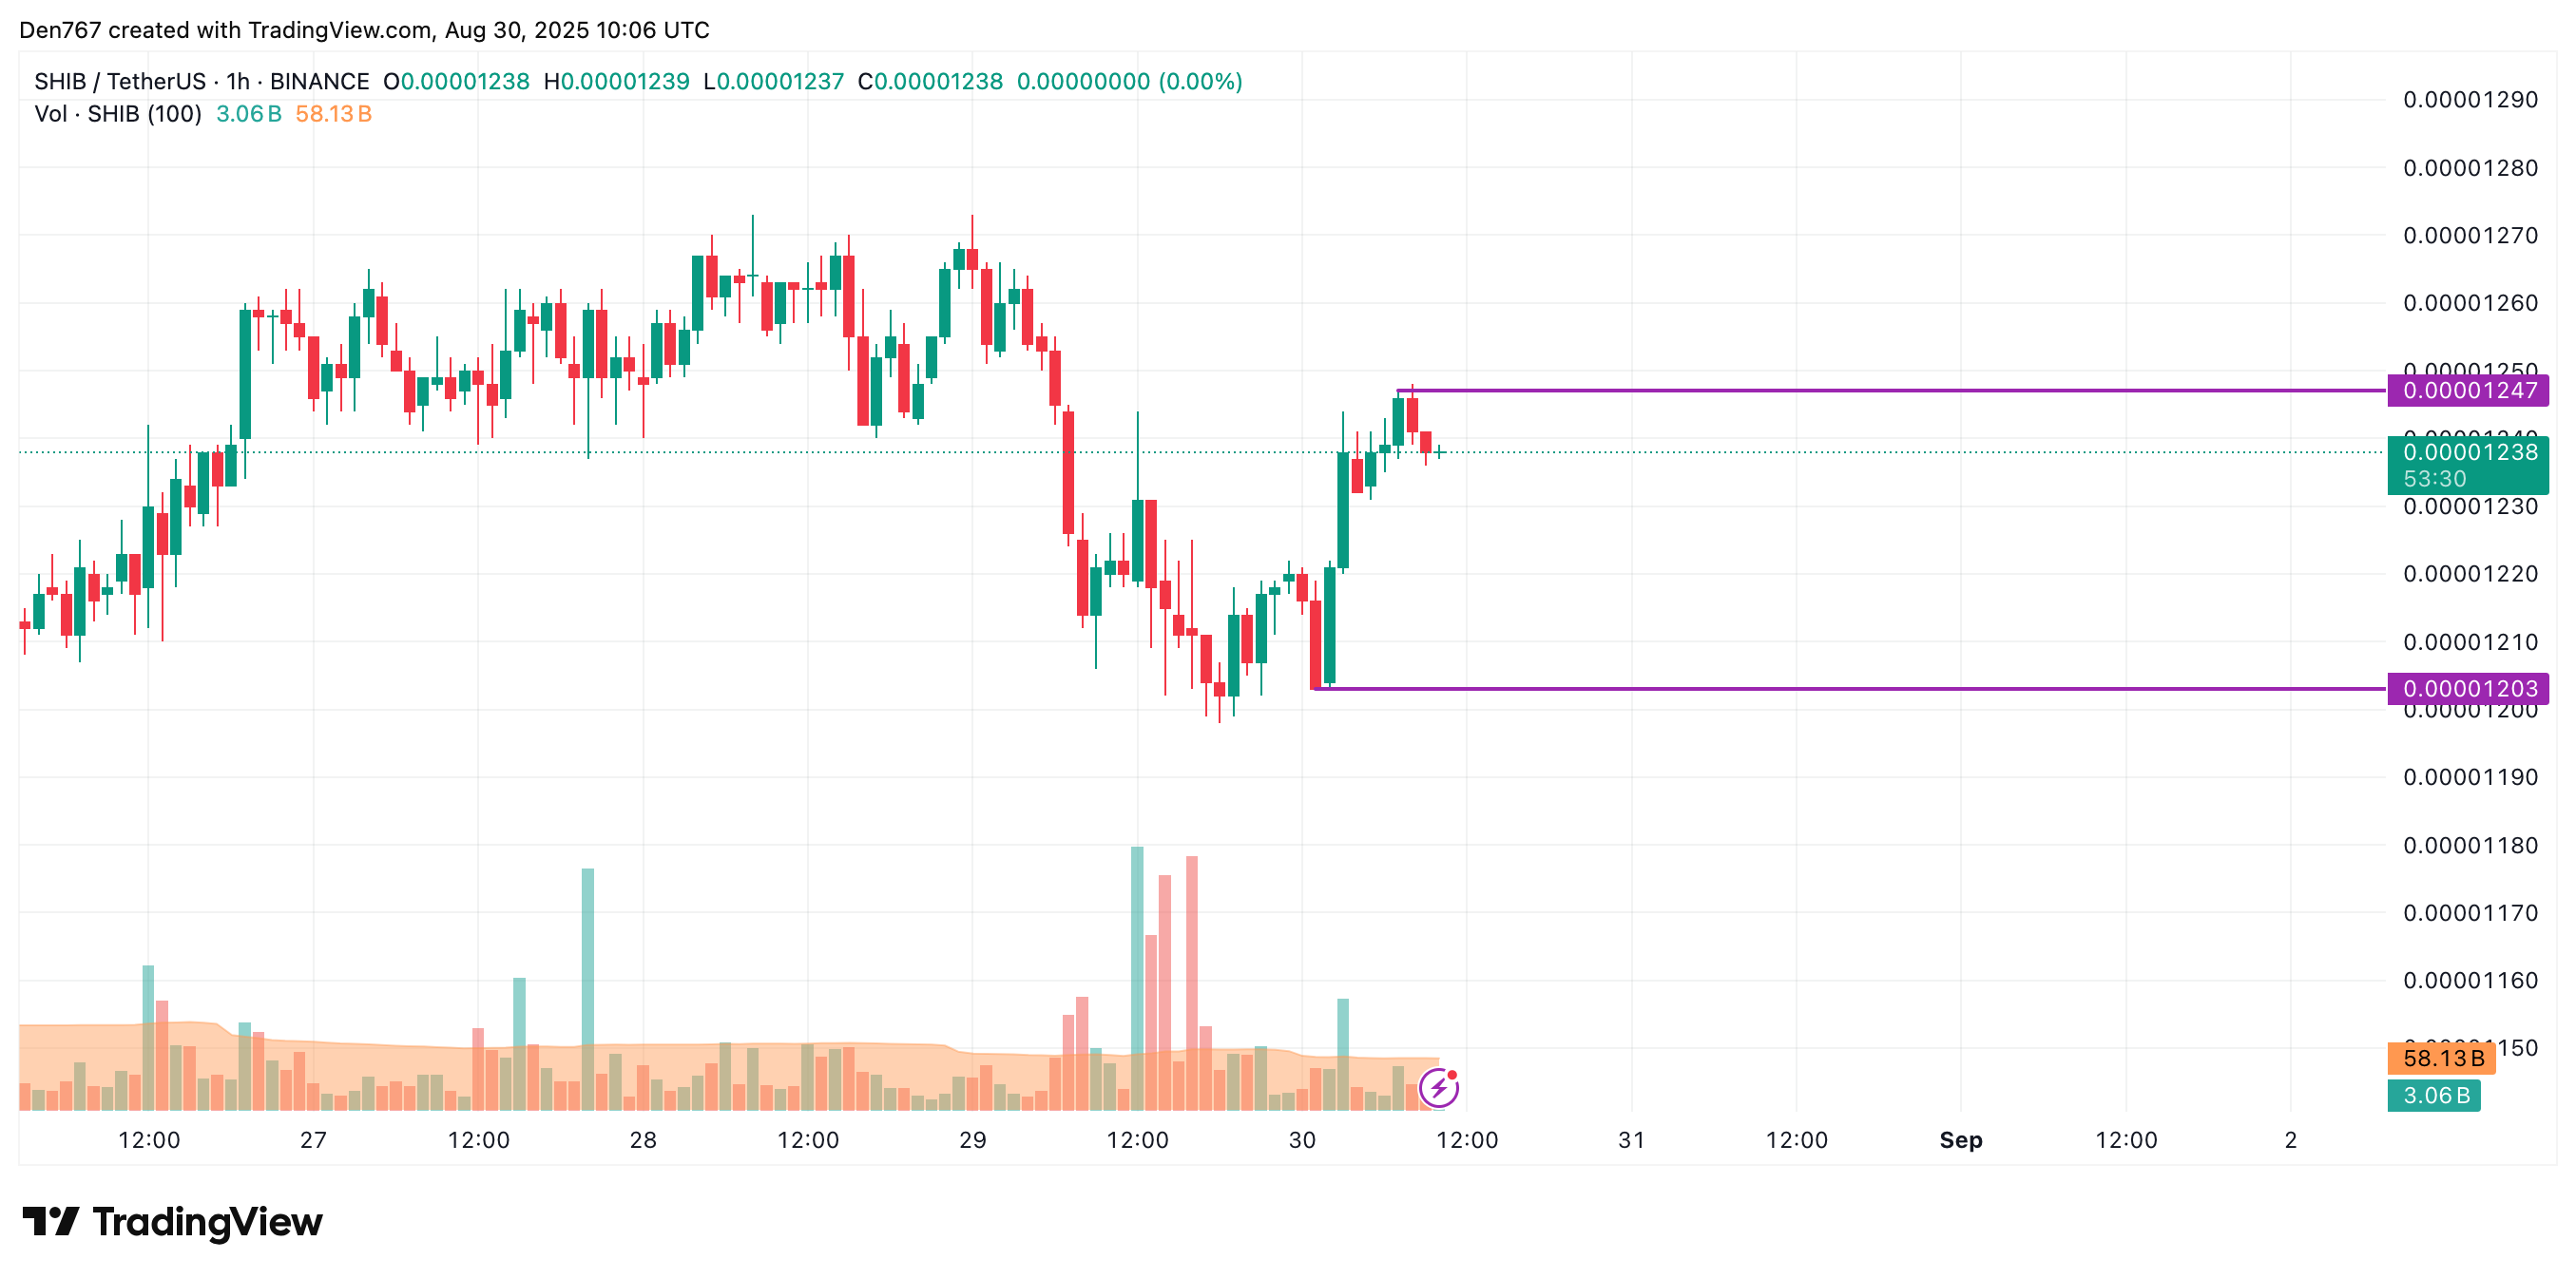
The hourly chart shows momentum building toward the $0.00001250–$0.00001270 resistance zone. If buyers push price above that range, momentum could carry SHIB higher in a short squeeze.

Conversely, if the interim area of $0.000012 is lost, a correction toward $0.00001160 is the most likely scenario. Trading volume is currently low, reducing the chance of a large directional move this week.
SHIB Could Reach $0.00001250–$0.00001270 on Break, or Fall Toward $0.00001160 if $0.000012 Support Fails image 1 Image by TradingView

Why does volume matter for SHIB price action?

Volume confirms conviction. Low volume means fewer participants support sustained breakouts or breakdowns. With current low volumes, false breakouts are more likely than decisive trends.

Market data referenced from CoinStats and TradingView indicate subdued activity ahead of the new trading week.
SHIB Could Reach $0.00001250–$0.00001270 on Break, or Fall Toward $0.00001160 if $0.000012 Support Fails image 2 Image by TradingView

Frequently Asked Questions

What support levels should traders watch for SHIB?

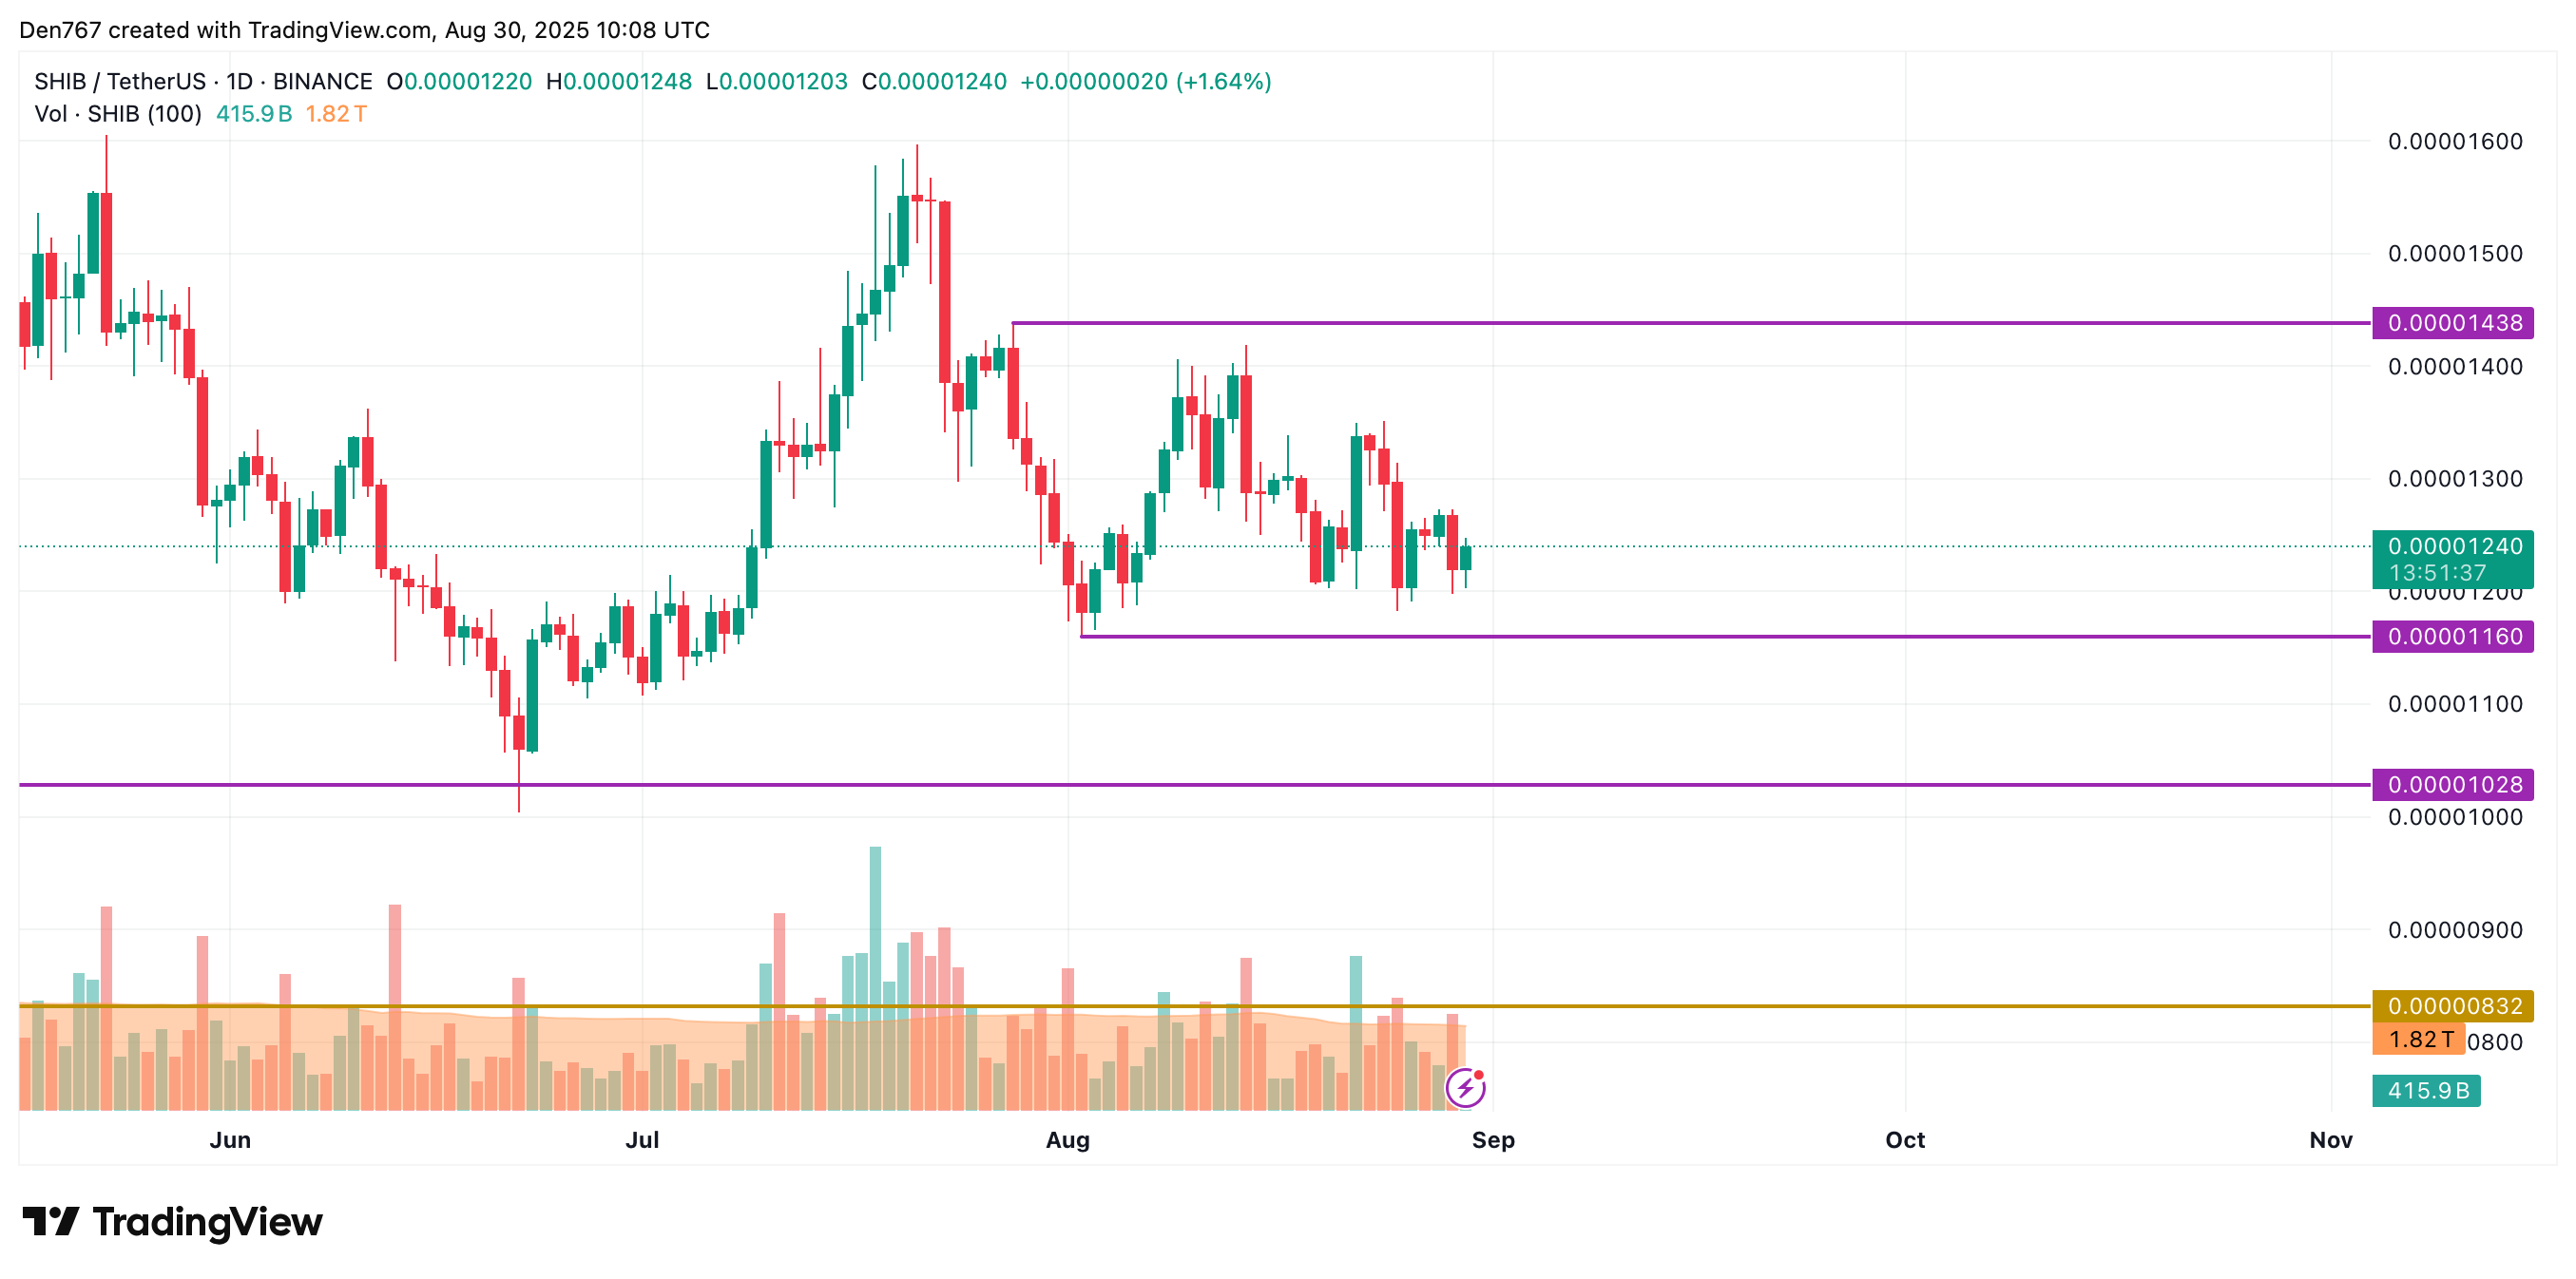
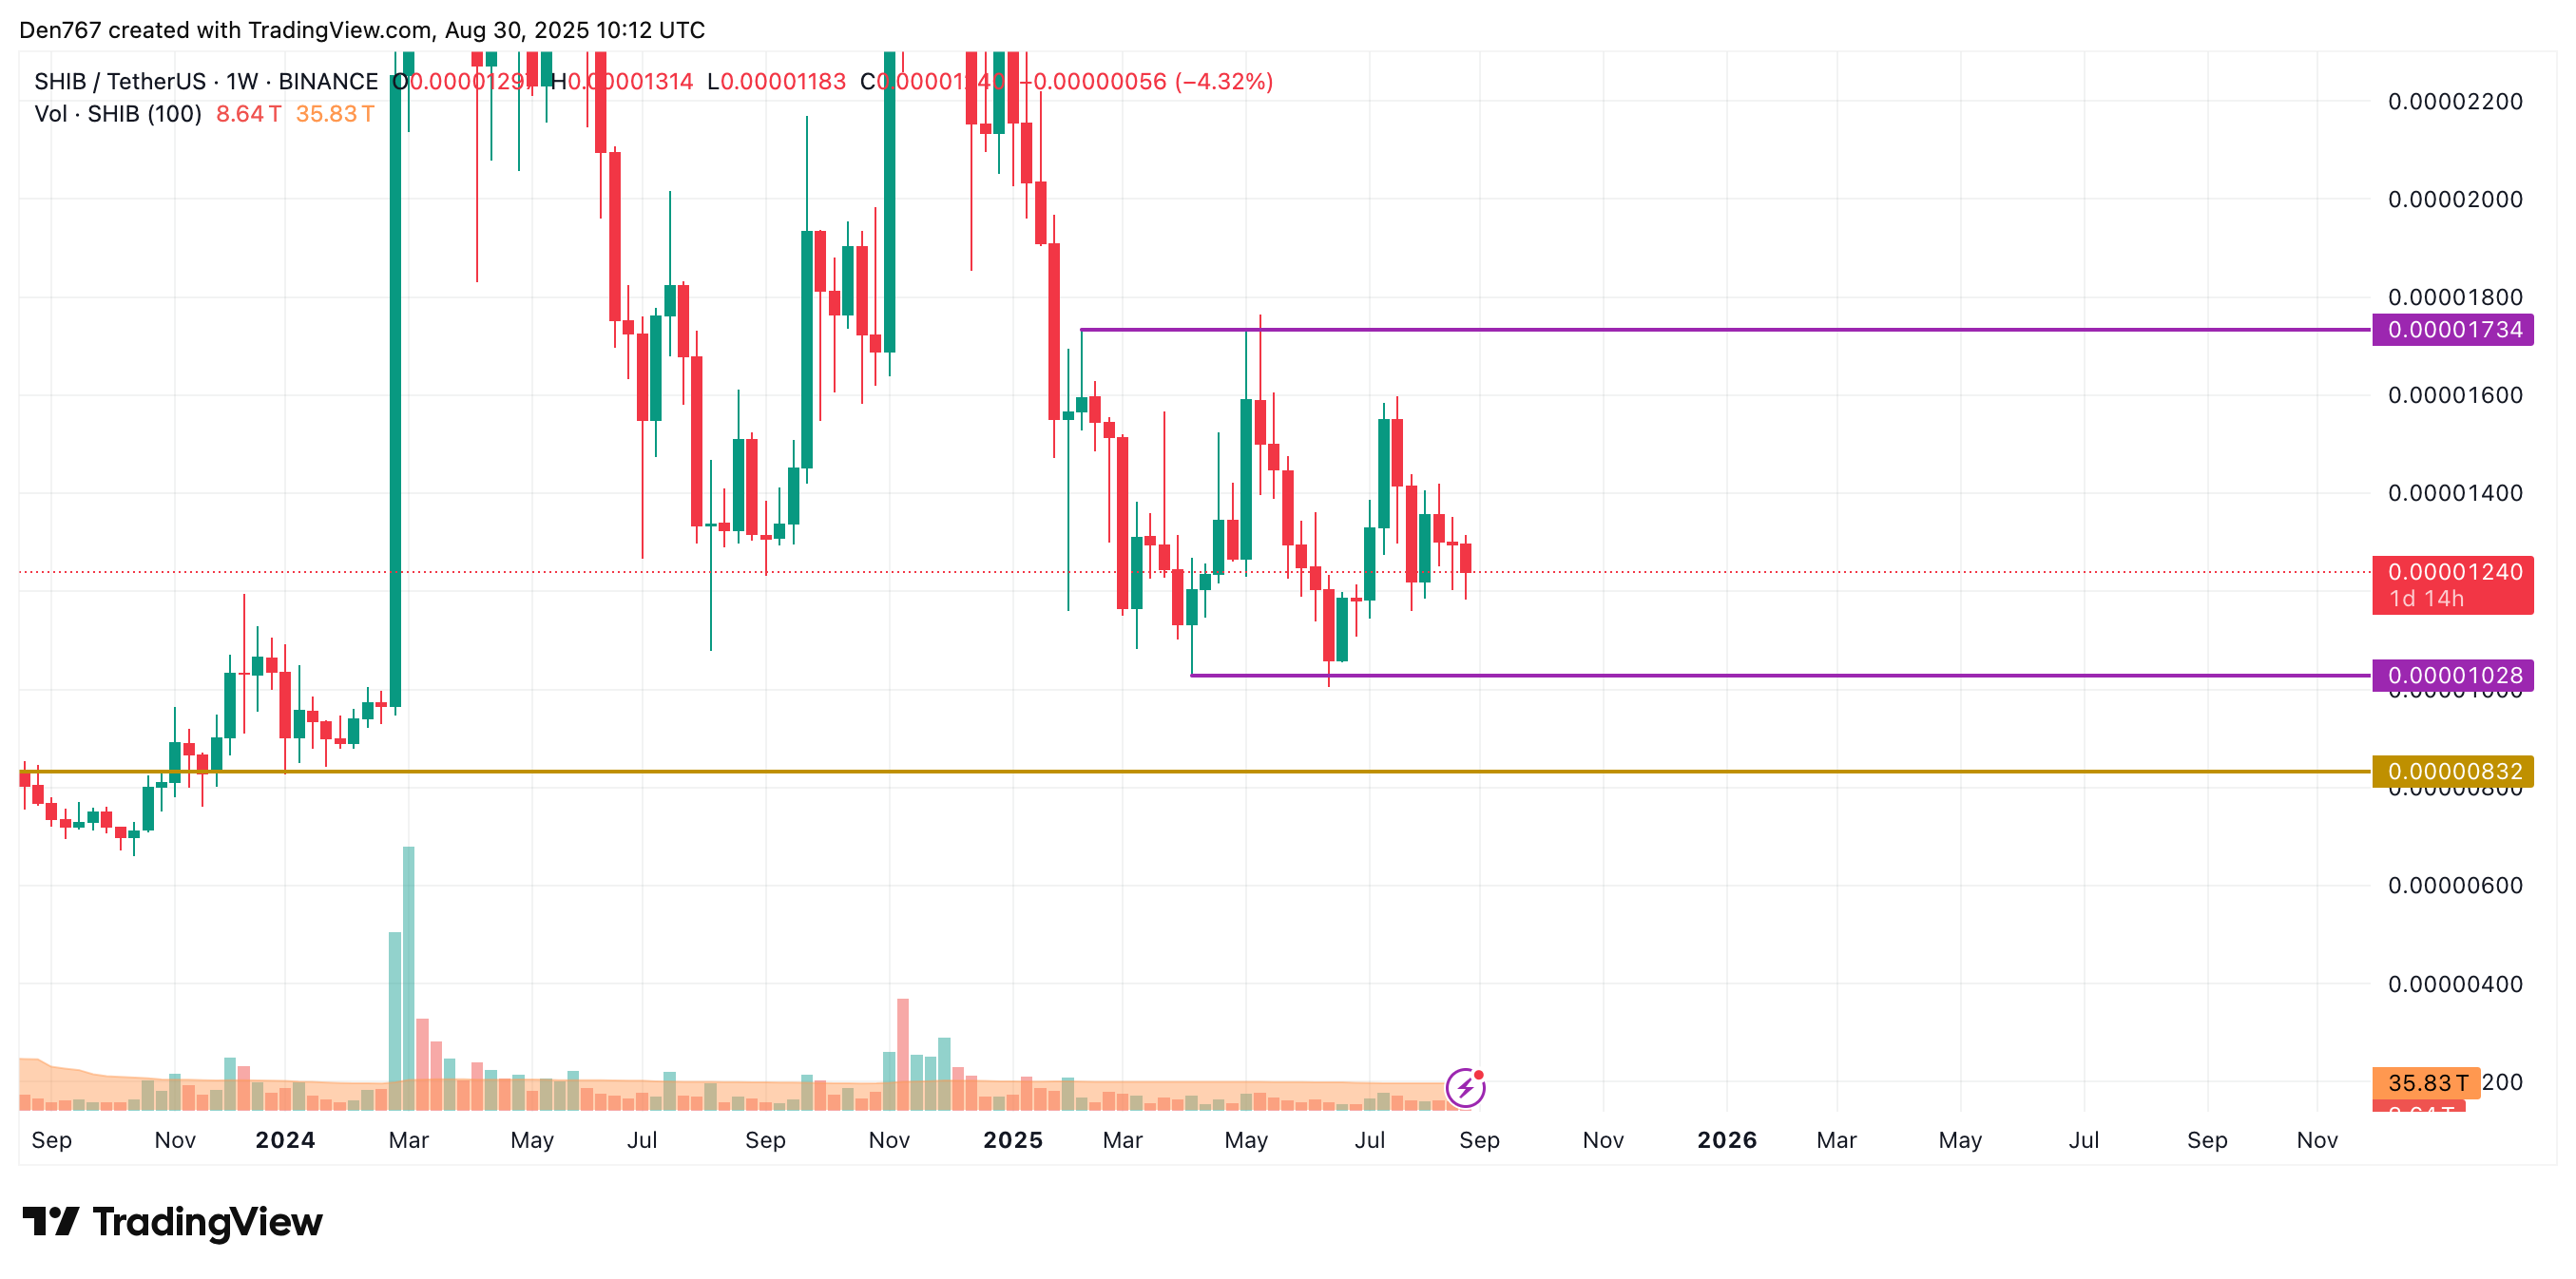
Traders should watch interim support at $0.000012 and primary support at $0.00001160. Loss of these areas could trigger deeper short-term corrections toward the next structural support.

How can traders confirm a valid SHIB breakout?

Confirm a breakout with a close above $0.00001270 on higher-than-average volume. Ideally, wait for a retest of the breakout level and renewed buying pressure.
SHIB Could Reach $0.00001250–$0.00001270 on Break, or Fall Toward $0.00001160 if $0.000012 Support Fails image 3 Image by TradingView

Key Takeaways

  • Price update: SHIB trades at $0.00001240, up 1.4% in 24h.
  • Levels to watch: Resistance $0.00001250–$0.00001270; support $0.000012 and $0.00001160.
  • Volume risk: Low volume reduces odds of a large, sustained move next week; confirm breakouts with volume.

Conclusion

SHIB shows short-term bullish signs but remains mid-term neutral as volume stays low. Watch $0.00001250–$0.00001270 for a bullish confirmation and $0.00001160 for downside risk. COINOTAG will continue to monitor on-chain indicators and exchange data to inform updates.

In Case You Missed It: Bitcoin Could Rally Toward $126K as BTC/Gold Volatility Hits Record Low, JP Morgan Says
0

Disclaimer: The content of this article solely reflects the author's opinion and does not represent the platform in any capacity. This article is not intended to serve as a reference for making investment decisions.

PoolX: Earn new token airdrops
Lock your assets and earn 10%+ APR
Lock now!

You may also like

The Behavioral Economics of GLD: How Investor Psychology Drives Gold's Safe-Haven Appeal in Turbulent Times

- 2025 saw iShares Gold Trust (GLD) reflect behavioral economics' reflection effect, as investor fear/greed drove volatile gold demand amid geopolitical tensions. - Gold prices surged to $3,500/oz as U.S.-China/Iran/Russia-Ukraine conflicts intensified, with central banks buying 710 tonnes/quarter to diversify from U.S. dollar reserves. - Technical analysis confirmed negative correlation between declining investor sentiment and gold volatility, while UBS projected 25.7% price rebound by late 2025. - Reflec

ainvest2025/08/31 12:21
The Behavioral Economics of GLD: How Investor Psychology Drives Gold's Safe-Haven Appeal in Turbulent Times

Solana News Today: Solana's Triangle Tightens—Institutional Bets Signal $280 Climb

- Solana (SOL) forms a tightening ascending triangle near $215, signaling potential breakout to $225–$280 if resistance is overcome. - Record $43.88B monthly futures volume and institutional accumulation (Upexi, Pantera) reinforce bullish momentum above $200 support. - ETF applications (Bitwise, 21Shares) and U.S. Commerce Department blockchain adoption highlight expanding real-world utility and institutional trust. - Analysts warn ETF approval delays and crypto market volatility remain key risks to Solana

ainvest2025/08/31 12:18
Solana News Today: Solana's Triangle Tightens—Institutional Bets Signal $280 Climb

Is Bitcoin's Recent Support Breakdown a Bear Market Signal or a Classic Fakeout?

- Bitcoin's August 2025 breakdown below $110,000 sparks debate: bear market signal or temporary "fakeout"? - Technical indicators show bearish divergence (RSI oversold, 200SMA resistance), but on-chain metrics reveal mixed signals (NVT suggests utility-driven strength). - Historical parallels (2021 $42k fakeout) indicate potential rebounds if price stabilizes above $105k, though institutionalization reduces retail-driven volatility. - ETF adoption and whale repositioning create tension between short-term b

ainvest2025/08/31 12:15
Is Bitcoin's Recent Support Breakdown a Bear Market Signal or a Classic Fakeout?

Bitcoin as a Premium Asset in High-Value Transactions: The Rise of Crypto in Luxury Real Estate

- Grant Cardone’s $43M Miami mansion listed for 400 Bitcoin highlights crypto’s growing role in luxury real estate transactions. - Institutional investors boost Bitcoin confidence via $9.485M WBTC purchase, signaling bullish sentiment and DeFi integration. - Analysts project $125K–$145K Bitcoin peak by 2025, driven by halving events, 401(k) adoption, and macroeconomic hedging demand. - Hybrid real estate-crypto models reduce counterparty risk but challenge regulators with AML/KYC enforcement in decentraliz

ainvest2025/08/31 12:15
Bitcoin as a Premium Asset in High-Value Transactions: The Rise of Crypto in Luxury Real Estate