Bitget App
Trade smarter
Buy cryptoMarketsTradeFuturesEarnSquareMore
Virtuals Protocol (VIRTUAL) To Soar Further? Key Harmonic Pattern Signals Potential Upside Move

Virtuals Protocol (VIRTUAL) To Soar Further? Key Harmonic Pattern Signals Potential Upside Move

CoinsProbeCoinsProbe2025/08/08 08:25
By:Nilesh Hembade

Date: Fri, Aug 08, 2025 | 06:04 AM GMT

The cryptocurrency market is showing renewed signs of strength, with Ethereum (ETH) reclaiming the $3,900 mark for the first time since late 2024. Riding this wave of momentum, several altcoins are beginning to show bullish breakouts — and one of the notable gainers is Virtuals Protocol (VIRTUAL).

Today, VIRTUAL is up 9%, and the technicals are aligning for potentially more upside.

Virtuals Protocol (VIRTUAL) To Soar Further? Key Harmonic Pattern Signals Potential Upside Move image 0 
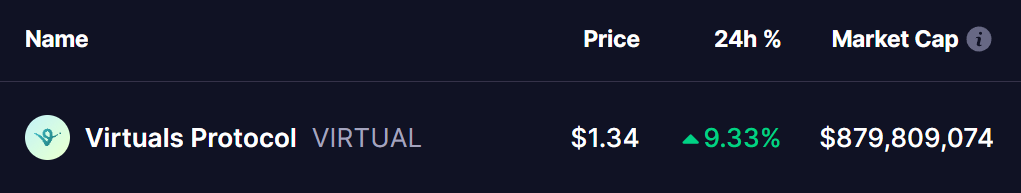
Source: Coinmarketcap

Harmonic Pattern Hints at Bullish Continuation

The chart shows a Bearish Cypher harmonic pattern in development — typically a bullish setup when the CD leg begins to accelerate, as we see now.

The pattern initiates at point X around $2.59, dips to point A, rebounds to point B, and then corrects down to point C, which was recently tagged around $1.12. From there, VIRTUAL has bounced back sharply and is now hovering near $1.34, testing the 200-day moving average at $1.3424 — a key resistance zone.

Virtuals Protocol (VIRTUAL) To Soar Further? Key Harmonic Pattern Signals Potential Upside Move image 1 
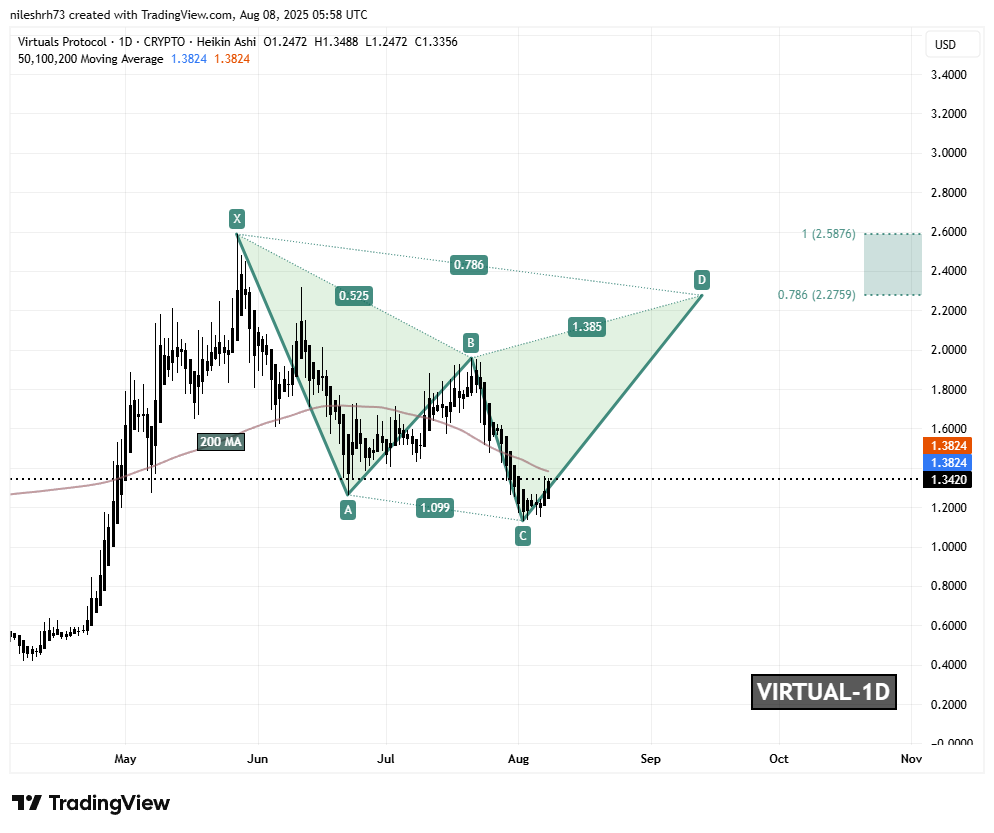
VIRTUAL Daily Chart/Coinsprobe (Source: Tradingview)

According to harmonic trading principles, the CD leg could potentially drive VIRTUAL into the Potential Reversal Zone (PRZ) between $2.2759 and $2.5876, which corresponds to the 0.786 to 1.0 Fibonacci extension levels. If this move plays out, it represents a potential gain of over 92% from current prices.

What’s Next for VIRTUAL?

For this bullish outlook to remain intact, VIRTUAL must break and sustain above the 200-day moving average with solid volume. A successful breakout could open the path to an extended rally toward the PRZ zone near $2.58.

However, caution is warranted. If price fails to hold above point C ($1.13), the structure could begin to break down, invalidating the current bullish setup and potentially leading to a deeper retracement.

0
0

Disclaimer: The content of this article solely reflects the author's opinion and does not represent the platform in any capacity. This article is not intended to serve as a reference for making investment decisions.

PoolX: Earn new token airdrops
Lock your assets and earn 10%+ APR
Lock now!

You may also like

The truth behind Bitcoin's overnight 9% surge: Is December the turning point for the crypto market?

Bitcoin strongly rebounded by 6.8% on December 3 to $92,000, while Ethereum surged 8% to break through $3,000, with mid- and small-cap tokens seeing even larger gains. The market rally was driven by multiple factors, including expectations of a Federal Reserve rate cut, Ethereum’s technical upgrades, and policy shifts. Summary generated by Mars AI. This summary was produced by the Mars AI model, and the accuracy and completeness of its content are still in the process of iterative updates.

MarsBit2025/12/03 08:33
The truth behind Bitcoin's overnight 9% surge: Is December the turning point for the crypto market?

Even BlackRock can't hold on? BTC ETF sees $3.5 billion outflow in a single month as institutions quietly "deleveraging"

The article analyzes the reasons behind cryptocurrency ETF outflows in November 2025 and their impact on issuers' revenues, comparing the historical performance of BTC and ETH ETFs as well as the current market situation. Summary generated by Mars AI. This summary is produced by the Mars AI model, and the accuracy and completeness of its generated content are still being iteratively updated.

MarsBit2025/12/03 08:33
Even BlackRock can't hold on? BTC ETF sees $3.5 billion outflow in a single month as institutions quietly "deleveraging"
© 2025 Bitget