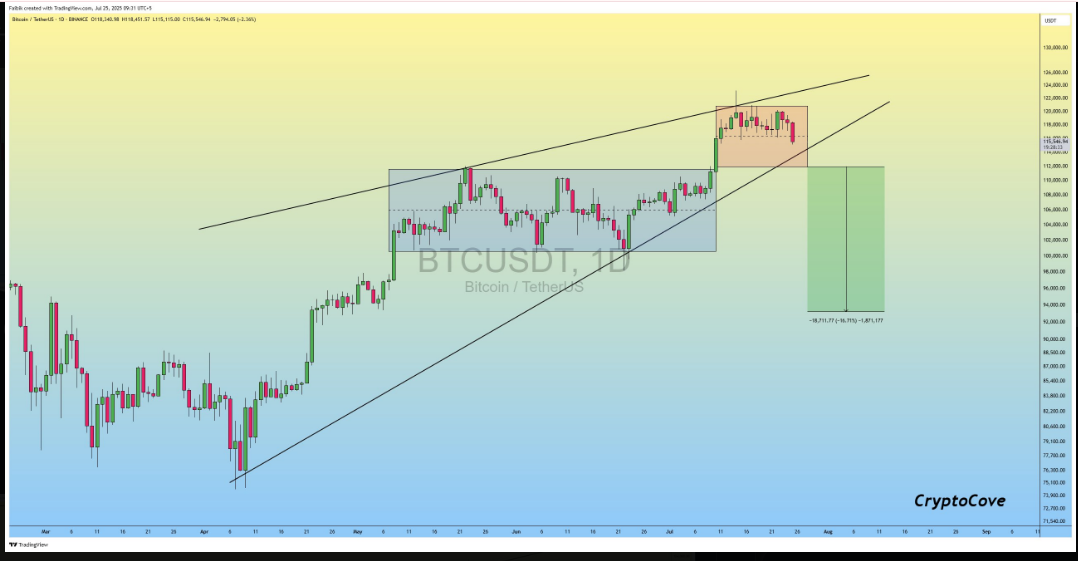
- Bitcoin’s daily chart reveals a rising wedge, a typically bearish formation suggesting the current uptrend may be losing steam.
- Despite recent declines, Bitcoin has held above the $115,259 support level. However, continued failure to break past $119,415 resistance limits upward momentum and keeps price action compressed within a narrow range.
- A daily close below $113,000 is now the key technical threshold. Until this happens, the market remains in consolidation, but traders should expect increased volatility near this level.
Bitcoin is trading at $115,511 as of now after it declined by 4.3% over the last week. The move is gaining significant attention due to the formation of a rising wedge pattern in the BTC/USDT daily chart.
A decline below the $113,000 mark on a day close could confirm this breakdown pattern, which may be a sign of a possible corrective move. The coin has had a 24-hour trading range of $115,259 and $119,415, and its $115,259 support level continues to be a major point to watch.
Rising Wedge Indicates Potential Weakness
The rising wedge structure is a key point of interest for technical analysts, as this pattern is often associated with a weakening uptrend. Notably, Bitcoin has struggled to build momentum since reaching recent highs, creating concerns about near-term price direction.
 Source: (X)
A confirmed breakdown below the wedge support would shift attention toward lower price targets. The failure to maintain the wedge could also increase volatility, with short-term moves becoming more pronounced around the $113,000 mark.
Resistance Challenges and Narrow Trading Range
Bitcoin has still been testing resistance at $119,415 but without a decisive breakout. The zone of resistance is now acting as a cap on price movements, limiting the upside. The inability to break through it comes as the weekly decline stretches 4.3%, an indicator of caution in the market.
The $115,259-$119,415 range has been setting the tone for recent trading activities. Moreover, the upper wedge boundary highlights the consolidation price action that can lead to a breakout or breakdown in the future sessions.
Breakdown Confirmation Requires Daily Close Below $113,000
A significant confirmation point is the $113,000 level closely observed by traders as a potential breakdown point. The close below this threshold on an individual day would confirm the wedge pattern and may result in the correction.
Prices move within the established structure until confirmation is witnessed. The market is showing signs of consolidating near current levels, and short-term trading behaviors are influenced by support and resistance.