Date: Fri, June 06, 2025 | 11:22 AM GMT
The broader cryptocurrency market has recently faced a sharp wave of pullback that rattled major assets. A heated political standoff between Elon Musk and Donald Trump added to the social media drama, intensifying bearish sentiment. As a result, Bitcoin (BTC) briefly dipped to $100,430 while Ethereum (ETH) slid to $2,387 before both bounced slightly to their current levels of around $104,000 and $2,492, respectively. This pullback wasn’t limited to the majors—altcoins like Worldcoin (WLD) also suffered.
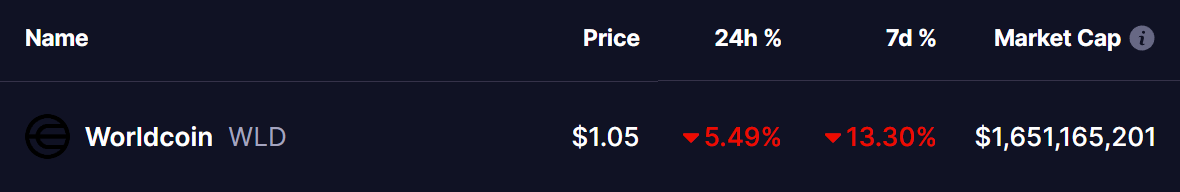
WLD registered a 5% intraday drop, extending its weekly decline to 13%. However, technical patterns now hint that a bounce could be on the horizon.
 Source: Coinmarketcap
Bearish Cypher Harmonic Pattern in Play
A deeper look at the 4-hour chart of WLD reveals the formation of a Bearish Cypher Harmonic Pattern, a well-known setup among technical analysts that often signals a potential short-term upside before a possible reversal near the end of the formation. The pattern began forming after WLD peaked near $1.4465 (point X), then dropped to $1.08 (point A). This was followed by a rebound to around $1.23 (point B), before dipping again to $1.01 (point C).
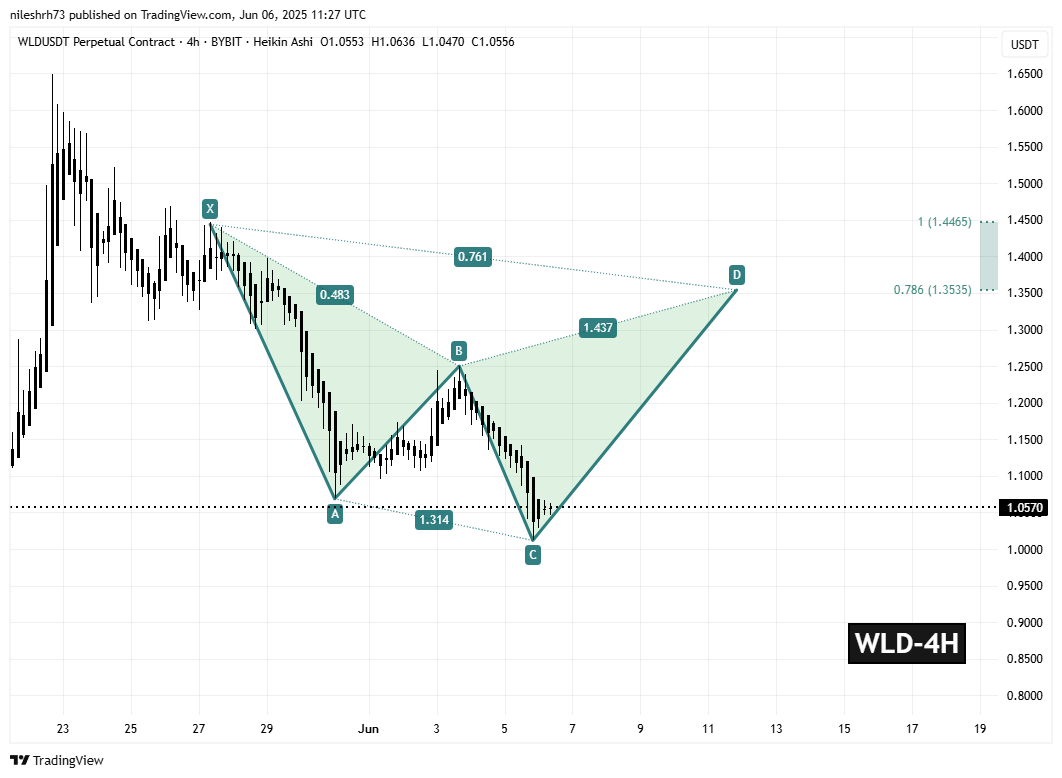 Worldcoin (WLD) 4H Chart/Coinsprobe (Source: Tradingview)
Since touching that recent low, WLD has begun its move upward—potentially heading toward the final leg at point D, projected between the $1.3535 to $1.4465 region. These levels align with critical Fibonacci zones: the 78.6% retracement of the XC leg and the 100% Fibonacci extension, both key areas where price reactions are typically expected.
If bullish momentum persists and this harmonic pattern plays out as expected, WLD could see an upside potential of approximately 28% to 36% from current levels.
What’s Next for WLD?
The next few sessions will be critical for WLD. A breakout continuation toward the $1.35 mark may attract more attention from short-term traders and algorithmic bots tracking harmonics. However, traders should also watch for potential resistance near the target zone, as it could trigger another wave of selling pressure once the pattern completes.
However, any failure to sustain momentum—especially a breakdown below point C—could invalidate the pattern and lead to further downside.
Disclaimer: This article is for informational purposes only and not financial advice. Always do your own research before making investment decisions in the crypto market.