
What If You Invest $1,000 in TRUMP Coin Right Now?

The Official Trump (TRUMP) coin is back in the spotlight with a fresh breakout and bullish momentum brewing across both short- and long-term charts. With renewed political buzz and meme coin hype returning, investors are now asking the big question is it the right time to jump in?
Let’s break down the charts and explore whether a $1,000 investment today could become something bigger tomorrow.
OFFICIAL TRUMP Price: Is TRUMP Price Gearing Up for a Major Rally?
 TRUMP/USD Daily Chart- TradingView
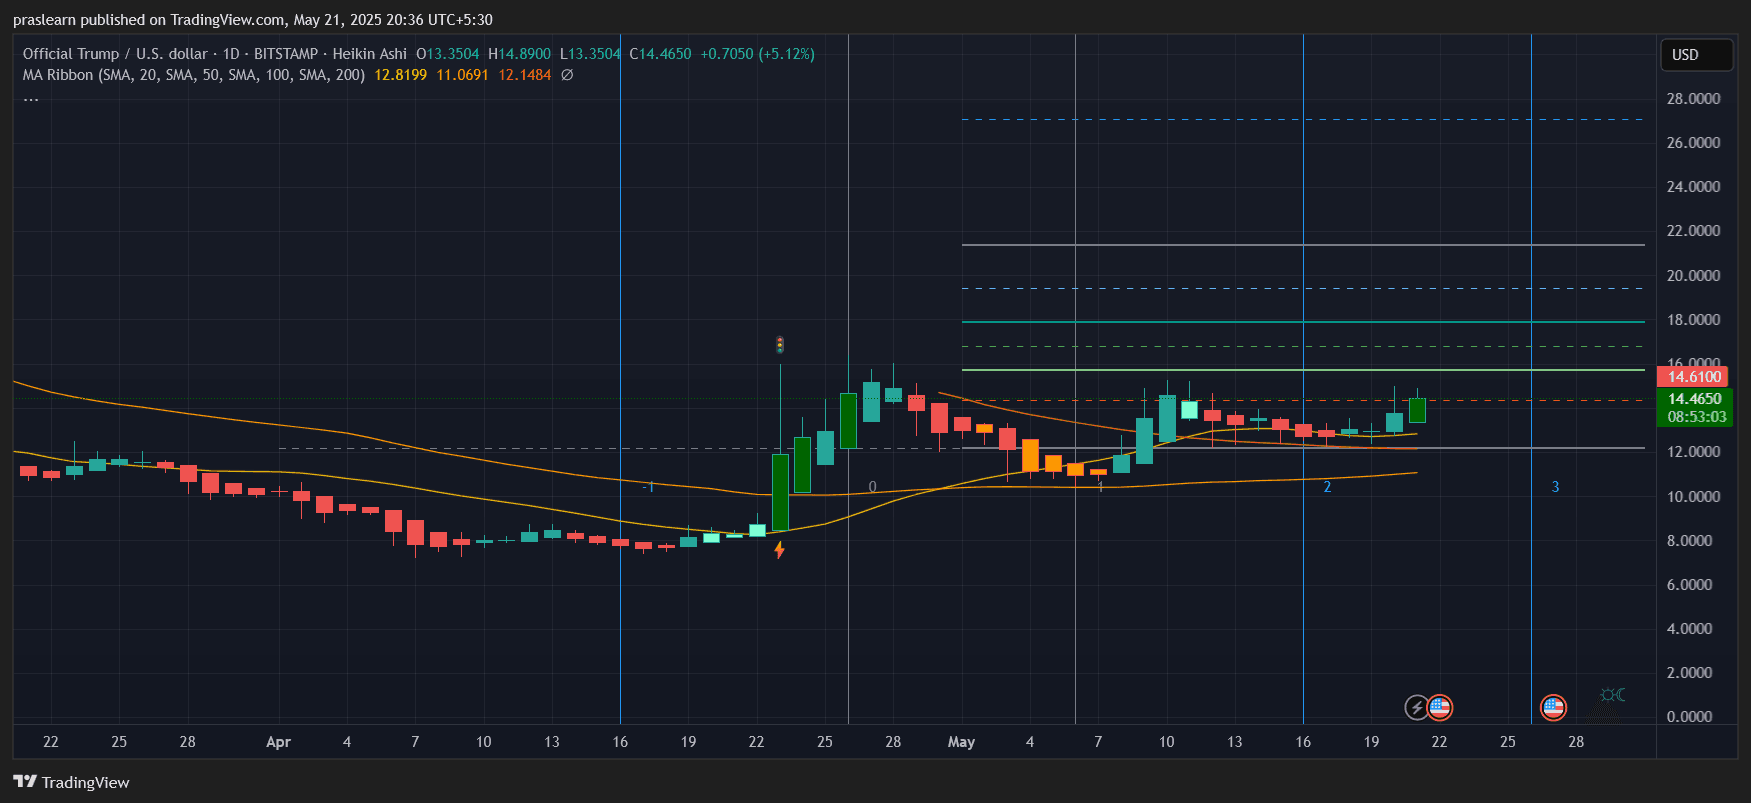
Looking at the daily chart, TRUMP price is attempting a solid comeback after consolidating for weeks between $11 and $13. The latest candle closed at $14.46, a +5.12% move in a single day, signaling renewed bullish interest.
More importantly, the price has now flipped above all key moving averages:
- 20 SMA: $12.81
- 50 SMA: $11.06
- 100 SMA: $12.14
This breakout above long-term resistance is a bullish technical signal. The previous swing high near $16 is now in sight, and if broken, price could target $18.70, followed by a psychological test of $20.
What's the Hourly Chart Telling Us?
 TRUMP/USD 1 Hr Chart- TradingView
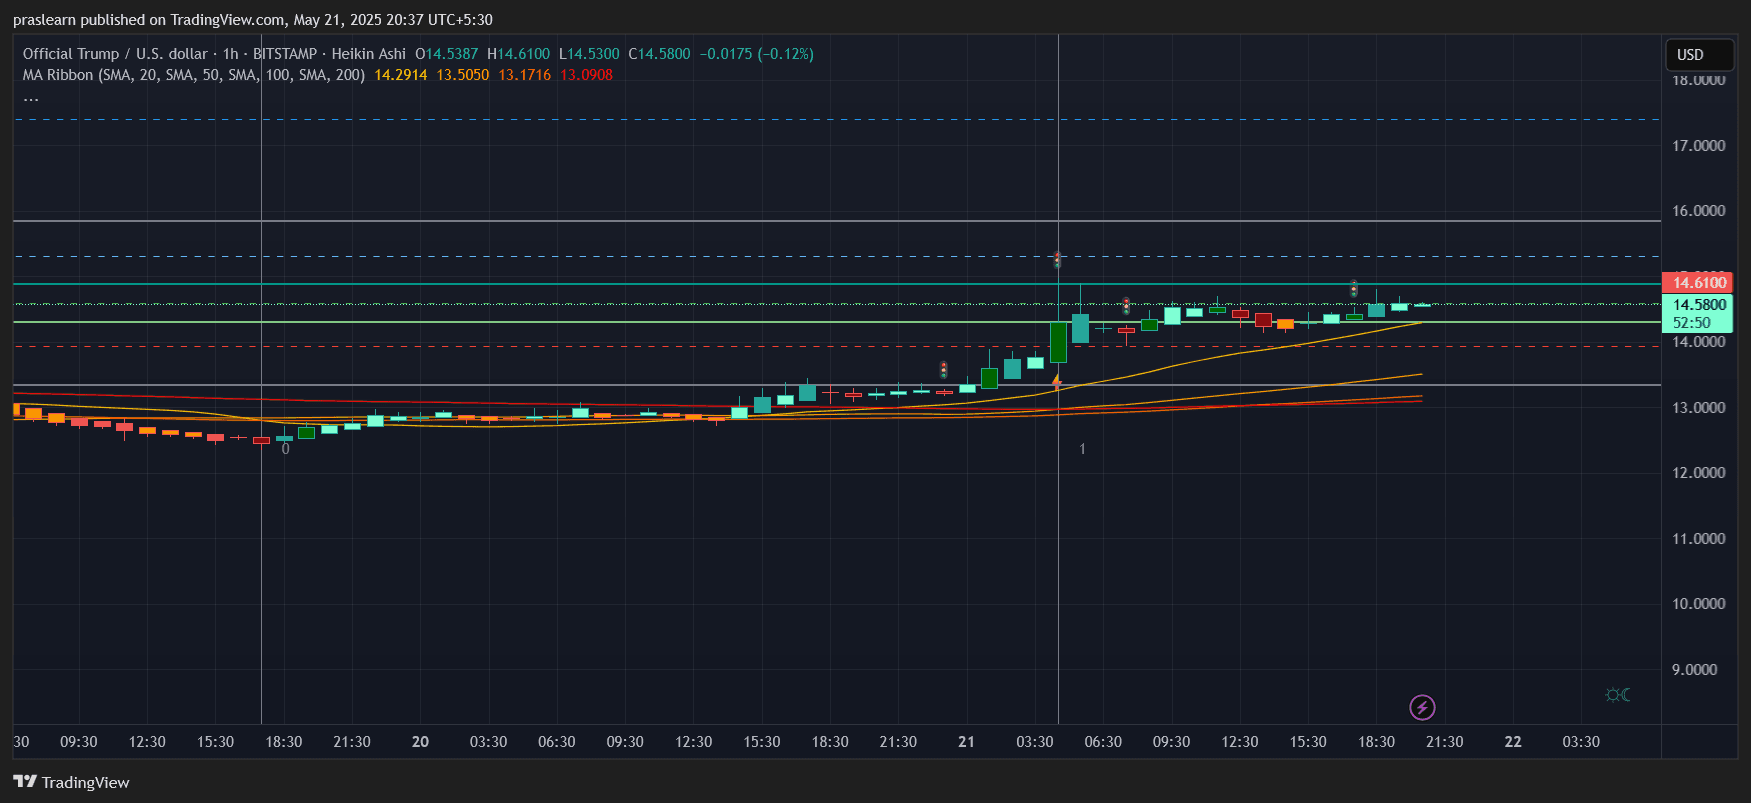
Zooming into the 1-hour chart , the Heikin Ashi candles show clean higher highs and higher lows—a textbook uptrend. The OFFICIAL TRUMP price is trading above the 20, 50, 100, and 200 SMAs:
- Immediate support: $14.29 (20 SMA)
- Near-term resistance: $14.61
The current structure is forming a flag-like continuation pattern, often preceding strong moves. If OFFICIAL TRUMP price sustains above $14.50 , we could see a near-term spike toward $16. The volume spikes seen earlier today support this bullish setup, pointing to accumulation.
If You Invest $1,000 in TRUMP Coin Today...
At the current price of $14.46, a $1,000 investment gets you approximately 69.19 TRUMP coins.
Now, let’s consider two potential upside scenarios based on chart targets:
- Scenario 1: TRUMP Price hits $18.70 (short-term breakout target)
Value of holdings = 69.19 × 18.70 = $1,294.85
Return = +29.48% - Scenario 2: TRUMP Price hits $25 (medium-term meme pump hype)
Value = 69.19 × 25 = $1,729.75
Return = +72.98%
The upside becomes even more attractive if TRUMP price reclaims its previous all-time highs closer to $30.
Is There Risk of a Pullback?
Absolutely. If TRUMP price fails to hold above the key support at $14.00 , a short-term correction toward $13 or even $12.20 is possible. The 50 and 100 SMAs on the daily chart will act as cushions, but a breakdown below $12 would weaken the current bullish thesis.
So for anyone investing now, it’s crucial to monitor the $14 level closely. It’s acting as a pivot, and price action around it in the next 24–48 hours will set the tone for what’s next.
Final Thoughts: Should You Buy TRUMP Coin Today?
From a technical standpoint, the OFFICIAL TRUMP price is breaking out from a textbook consolidation zone with strong moving average support and bullish momentum on both hourly and daily timeframes.
If the OFFICIAL TRUMP price holds above $14.50 and breaks $16, this could be the beginning of a mini-altseason for political and meme tokens. The upside toward $18–$25 is real, backed by both chart structure and upcoming political catalysts.
A $1,000 bet today isn’t guaranteed to double overnight—but it could very well ride the next meme wave if sentiment catches fire. In crypto, timing the trend is everything—and TRUMP price seems ready to make headlines again.
The Official Trump (TRUMP) coin is back in the spotlight with a fresh breakout and bullish momentum brewing across both short- and long-term charts. With renewed political buzz and meme coin hype returning, investors are now asking the big question is it the right time to jump in?
Let’s break down the charts and explore whether a $1,000 investment today could become something bigger tomorrow.
OFFICIAL TRUMP Price: Is TRUMP Price Gearing Up for a Major Rally?
TRUMP/USD Daily Chart- TradingView
Looking at the daily chart, TRUMP price is attempting a solid comeback after consolidating for weeks between $11 and $13. The latest candle closed at $14.46, a +5.12% move in a single day, signaling renewed bullish interest.
More importantly, the price has now flipped above all key moving averages:
- 20 SMA: $12.81
- 50 SMA: $11.06
- 100 SMA: $12.14
This breakout above long-term resistance is a bullish technical signal. The previous swing high near $16 is now in sight, and if broken, price could target $18.70, followed by a psychological test of $20.
What's the Hourly Chart Telling Us?
TRUMP/USD 1 Hr Chart- TradingView
Zooming into the 1-hour chart , the Heikin Ashi candles show clean higher highs and higher lows—a textbook uptrend. The OFFICIAL TRUMP price is trading above the 20, 50, 100, and 200 SMAs:
- Immediate support: $14.29 (20 SMA)
- Near-term resistance: $14.61
The current structure is forming a flag-like continuation pattern, often preceding strong moves. If OFFICIAL TRUMP price sustains above $14.50 , we could see a near-term spike toward $16. The volume spikes seen earlier today support this bullish setup, pointing to accumulation.
If You Invest $1,000 in TRUMP Coin Today...
At the current price of $14.46, a $1,000 investment gets you approximately 69.19 TRUMP coins.
Now, let’s consider two potential upside scenarios based on chart targets:
- Scenario 1: TRUMP Price hits $18.70 (short-term breakout target)
Value of holdings = 69.19 × 18.70 = $1,294.85
Return = +29.48% - Scenario 2: TRUMP Price hits $25 (medium-term meme pump hype)
Value = 69.19 × 25 = $1,729.75
Return = +72.98%
The upside becomes even more attractive if TRUMP price reclaims its previous all-time highs closer to $30.
Is There Risk of a Pullback?
Absolutely. If TRUMP price fails to hold above the key support at $14.00 , a short-term correction toward $13 or even $12.20 is possible. The 50 and 100 SMAs on the daily chart will act as cushions, but a breakdown below $12 would weaken the current bullish thesis.
So for anyone investing now, it’s crucial to monitor the $14 level closely. It’s acting as a pivot, and price action around it in the next 24–48 hours will set the tone for what’s next.
Final Thoughts: Should You Buy TRUMP Coin Today?
From a technical standpoint, the OFFICIAL TRUMP price is breaking out from a textbook consolidation zone with strong moving average support and bullish momentum on both hourly and daily timeframes.
If the OFFICIAL TRUMP price holds above $14.50 and breaks $16, this could be the beginning of a mini-altseason for political and meme tokens. The upside toward $18–$25 is real, backed by both chart structure and upcoming political catalysts.
A $1,000 bet today isn’t guaranteed to double overnight—but it could very well ride the next meme wave if sentiment catches fire. In crypto, timing the trend is everything—and TRUMP price seems ready to make headlines again.
Disclaimer: The content of this article solely reflects the author's opinion and does not represent the platform in any capacity. This article is not intended to serve as a reference for making investment decisions.
You may also like
Mars Morning News | The crypto market rebounds across the board, Bitcoin rises above $94,500; The "CLARITY Act" draft is expected to be released this week
The crypto market has fully rebounded, with bitcoin surpassing $94,500 and US crypto-related stocks rising across the board. The US Congress is advancing the CLARITY Act to regulate cryptocurrencies. The SEC chairman stated that many ICOs are not securities transactions. Whales are holding a large number of profitable ETH long positions. Summary generated by Mars AI. The accuracy and completeness of the content generated by the Mars AI model is still being iteratively updated.

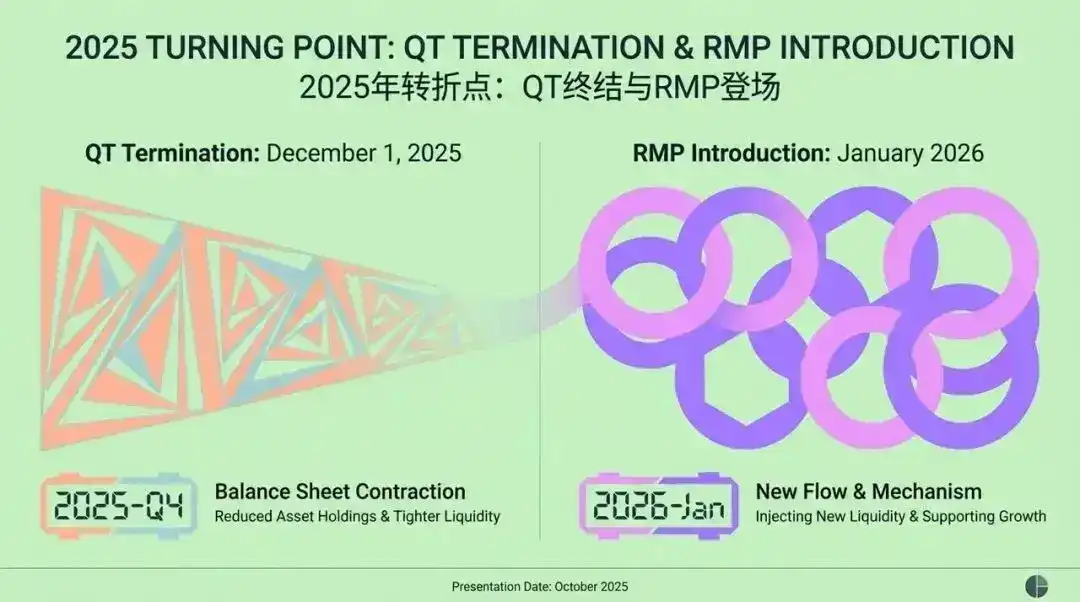
Federal Reserve’s Major Shift: From QT to RMP, How Will the Market Transform by 2026?
The article discusses the background, mechanism, and impact on financial markets of the Federal Reserve's introduction of the Reserve Management Purchases (RMP) strategy after ending Quantitative Tightening (QT) in 2025. RMP is regarded as a technical operation aimed at maintaining liquidity in the financial system, but the market interprets it as a covert easing policy. The article analyzes RMP's potential effects on risk assets, the regulatory framework, and fiscal policy, and provides strategic recommendations for institutional investors. Summary generated by Mars AI This summary was generated by the Mars AI model, and the accuracy and completeness of its content are still in the process of iterative improvement.
Rate Hike in Japan: Will Bitcoin Resist Better Than Expected?

Crucial Decision: Trump’s Final Interviews for Federal Reserve Chair Could Reshape Markets