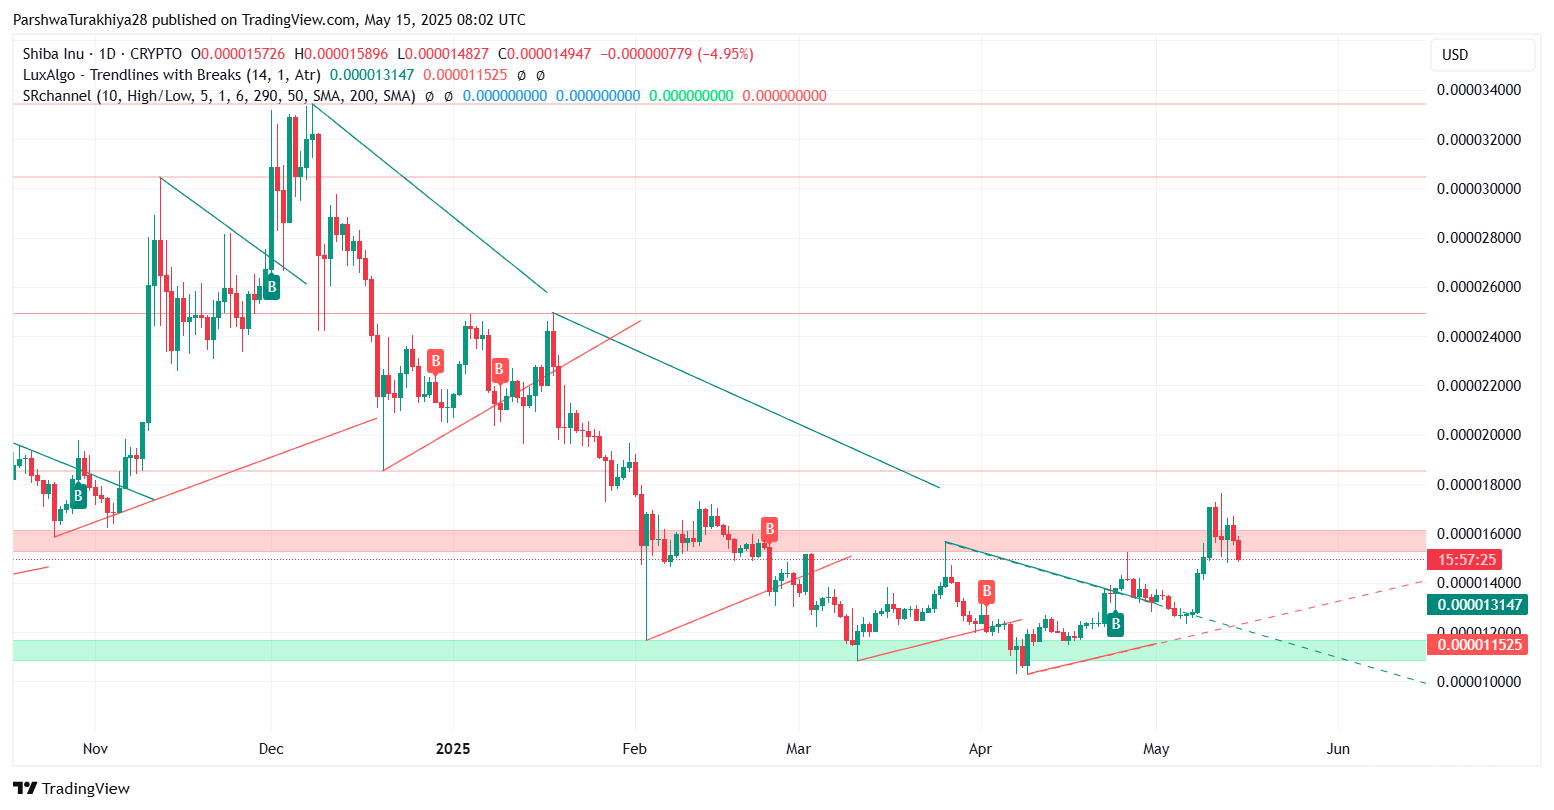
The Shiba Inu price today is hovering around $0.00001486 after slipping from a recent high near $0.00001746. This drop marks a retracement of nearly 15% over the past three sessions, pulling SHIB back into a former demand zone. While short-term indicators are flashing oversold conditions, broader price structure shows that bulls are attempting to hold this area as support.
 Shiba Inu price dynamics (Source: TradingView)
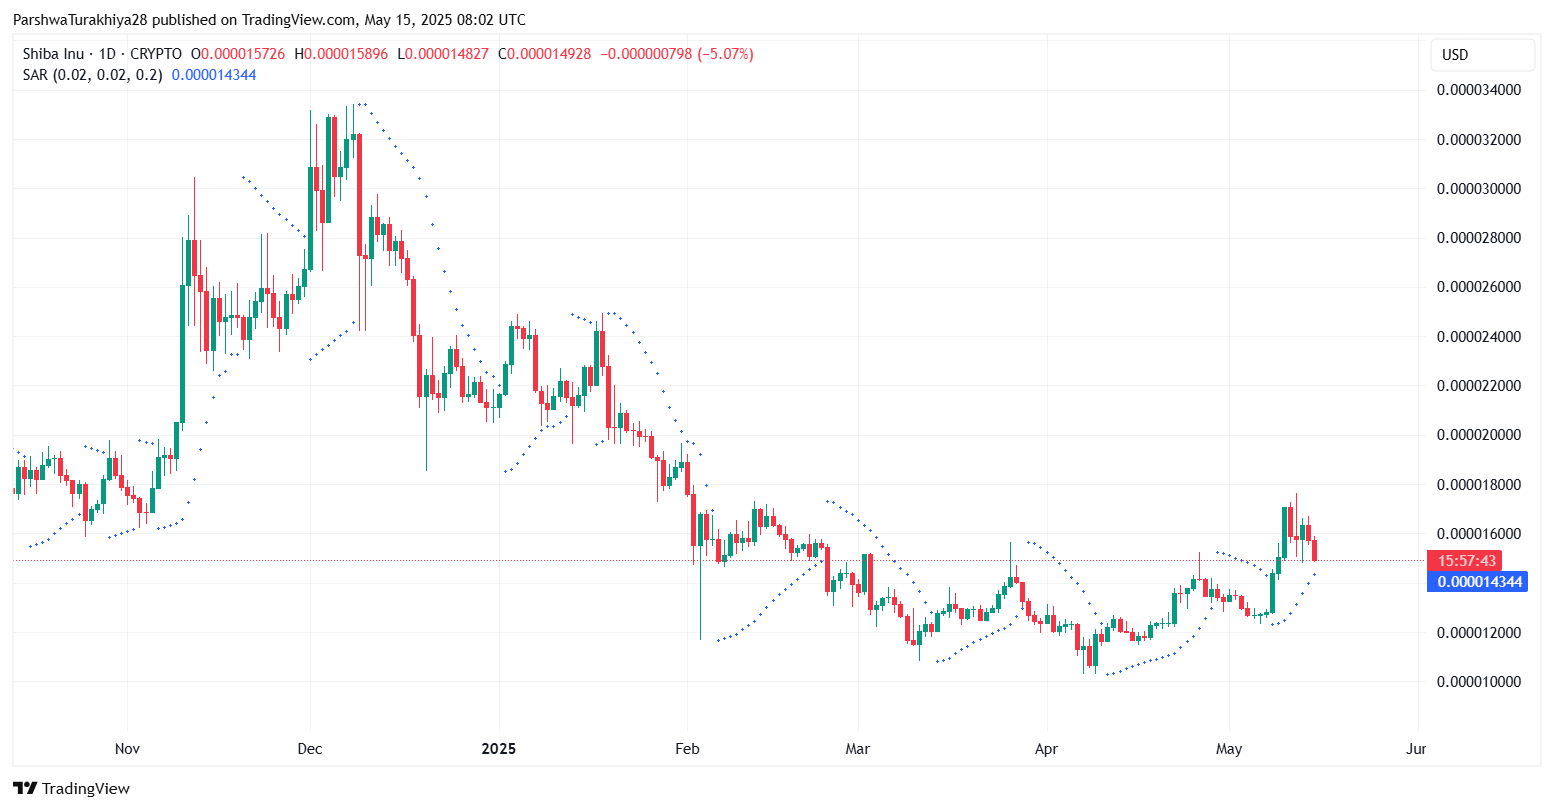
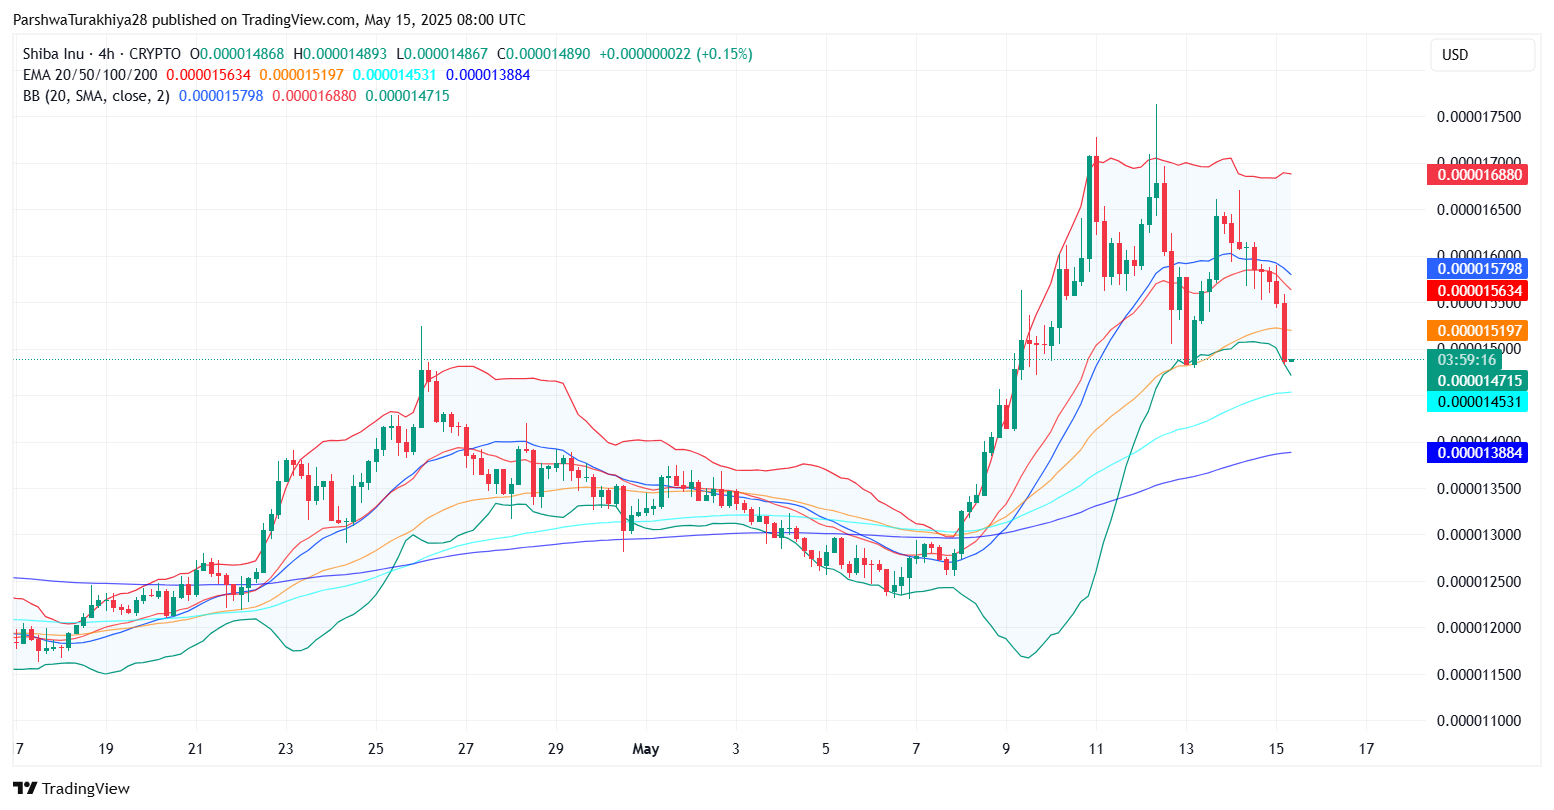
From a technical lens, the Parabolic SAR on the daily chart has flipped above price action, signaling a bearish trend continuation unless reversed. Meanwhile, the Bollinger Bands on the 4-hour chart show price falling below the mid-band and approaching the lower band at $0.00001471, suggesting a potential volatility expansion on the downside.
Why Shiba Inu Price Going Down Today?
Why Shiba Inu price going down today can be attributed to profit-taking after a sharp Shiba Inu price spike earlier this month. As seen on the 4-hour and daily charts, SHIB faced heavy resistance near the $0.00001700 level, triggering a sequence of lower highs.
 Shiba Inu price dynamics (Source: TradingView)
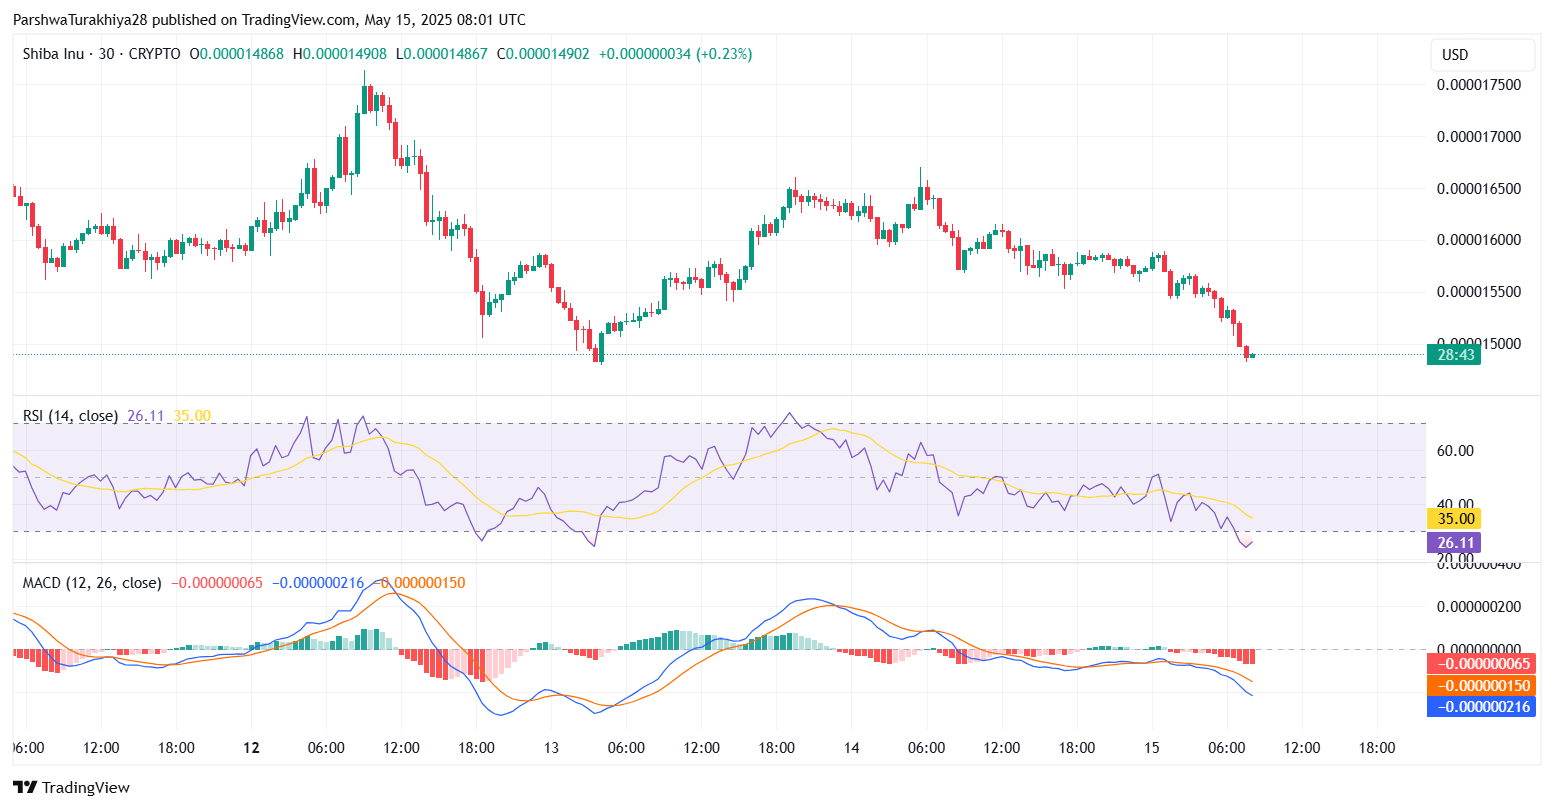
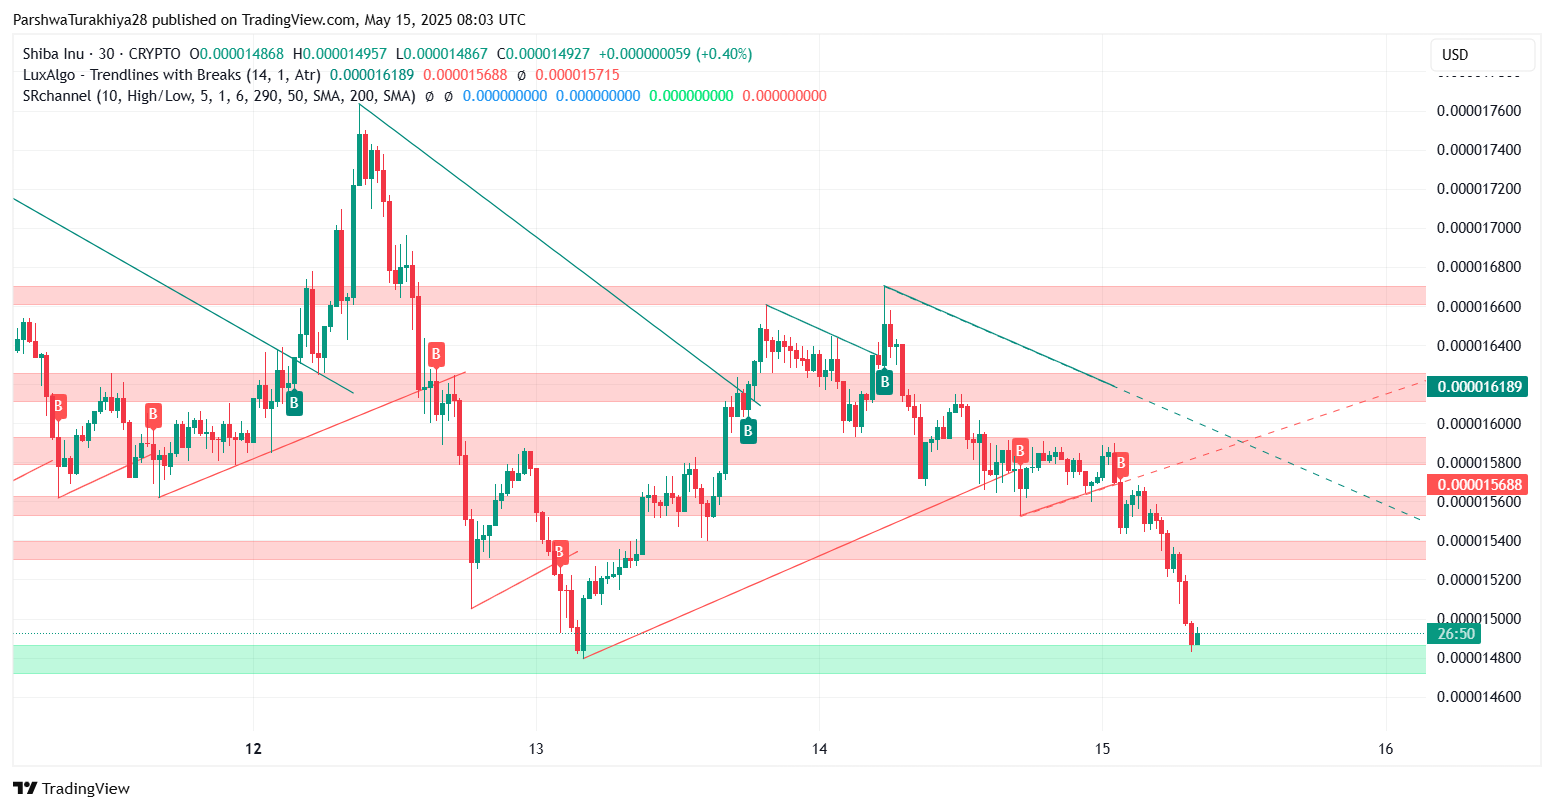
On the 30-minute chart, RSI has dipped to 26.11—deep in oversold territory—while MACD is printing widening red bars with a bearish crossover. This suggests short-term momentum remains against the bulls, and any rebound may face resistance around $0.00001560 and $0.00001588.
Despite the weakness, there is early evidence of support forming between $0.00001430 and $0.00001450. This zone coincides with previous breakout levels and sits just above the 200 EMA on the 4-hour timeframe.
SHIB Tests Key Support Amid High Volatility
 Shiba Inu price dynamics (Source: TradingView)
The Shiba Inu price volatility has expanded sharply in recent sessions. After a breakout on May 10 above $0.00001500, SHIB surged past $0.00001740 before reversing just as fast. Bollinger Bands widened rapidly on the upside, and now SHIB has retraced toward the lower band, where the current price consolidates.
The 4-hour chart also shows price slipping below the 20 and 50 EMA, which now act as immediate resistance. The 100 EMA at $0.00001453 and 200 EMA at $0.00001388 are key support levels to watch. A breakdown below $0.00001430 could risk exposing $0.00001320 next.
Will Shiba Inu Hold the $0.00001430 Support?
SHIB’s short-term fate hinges on its ability to hold above the horizontal demand zone marked near $0.00001430. The ascending trendline from the May 1 breakout remains intact on the 4-hour timeframe, intersecting with this level.
 Shiba Inu price dynamics (Source: TradingView)
On the daily chart, SHIB is still trading above the major breakout region from April. However, the trend is weakening, and further downside could push price toward the 200-day SMA at $0.00001344.
 Shiba Inu price dynamics (Source: TradingView)
To reclaim bullish control, bulls must first flip $0.00001560 into support and then attempt a re-test of $0.00001618, where a descending trendline currently caps the structure.
Shiba Inu Price Forecast Table for May 16
| Indicator/Zone | Level (USD) | Signal Description |
| Immediate Resistance 1 | 0.00001560 | Minor intraday ceiling |
| Resistance 2 | 0.00001618 | Key descending trendline cap |
| Immediate Support 1 | 0.00001430 | Crucial horizontal demand zone |
| Support 2 | 0.00001320 | Prior breakout + trendline confluence |
| RSI (30-min) | 26.11 | Oversold |
| MACD (30-min) | Bearish crossover | Negative momentum building |
| 200 EMA (4H) | 0.00001388 | Long-term dynamic support |
| Volatility Outlook | Rising | Expansion likely post-pullback |
The Shiba Inu price has entered a critical technical zone. If bulls can reclaim the $0.00001500 level with volume, SHIB could target a short-term rebound toward $0.00001618. But if current support breaks, the next leg down could push toward the $0.00001300s. Traders should watch RSI recovery and MACD flattening for early signs of a bounce.
Disclaimer: The information presented in this article is for informational and educational purposes only. The article does not constitute financial advice or advice of any kind. Coin Edition is not responsible for any losses incurred as a result of the utilization of content, products, or services mentioned. Readers are advised to exercise caution before taking any action related to the company.