
SOL Price Explodes Past $150—What’s Next?

Solana (SOL) has once again captured the spotlight as bullish momentum builds across the broader crypto market. After weeks of sideways movement and consolidation, SOL price is now showing signs of a potential breakout that could set the stage for a major rally. With growing investor interest, positive network fundamentals, and bullish chart formations, traders are watching Solana price closely to see if it can reclaim higher levels . In this article, we’ll dive deep into the current technical landscape using the latest TradingView daily and hourly charts, break down key resistance zones, and forecast what lies ahead for one of the most talked-about altcoins in the market.
Solana Price Prediction: Is a New Rally Brewing?
 SOL/USD Daily Chart- TradingView
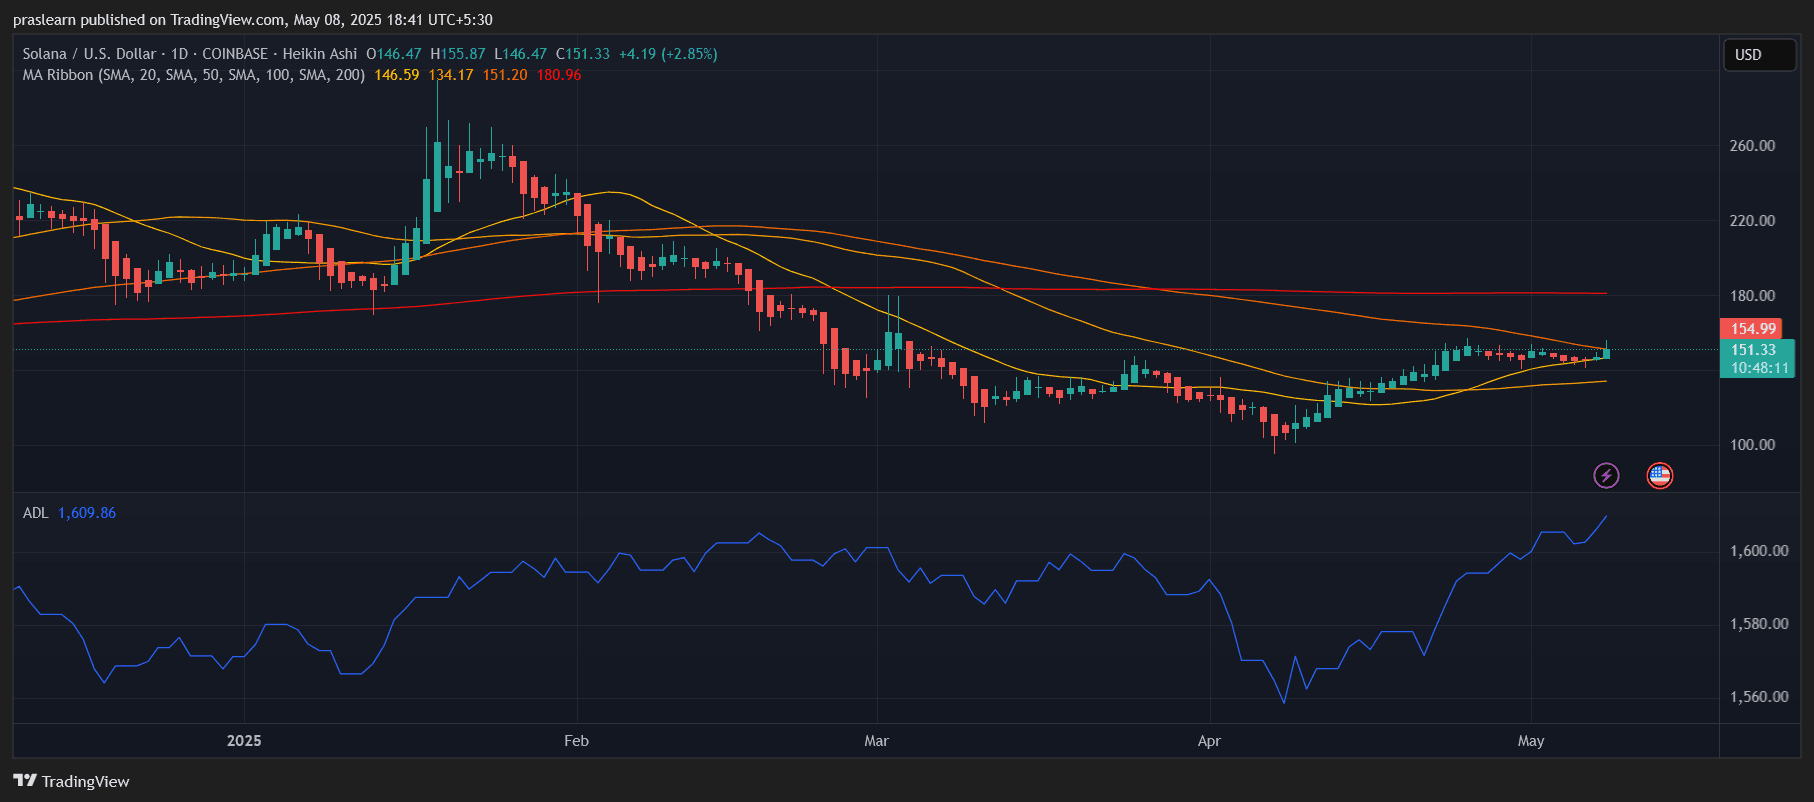
Solana (SOL) has seen a powerful bullish breakout , with the price currently trading near $154. On the daily chart, SOL has cleared the 50-day and 100-day moving averages and is now challenging the 200-day SMA at $155. This is a critical resistance zone that previously triggered sell-offs. A successful close above this zone would flip the market structure firmly bullish and open the path toward $180 and possibly even $200 in the near term.
The Advance-Decline Line (ADL) is also showing strength, with values rising steadily, suggesting that accumulation is underway and large market players may be stepping in. The MA ribbon on the daily chart is starting to converge, a signal that consolidation may soon give way to a trend expansion.
Hourly Chart: Bulls Take Control
 SOL/USD 1 Hr Chart- TradingView
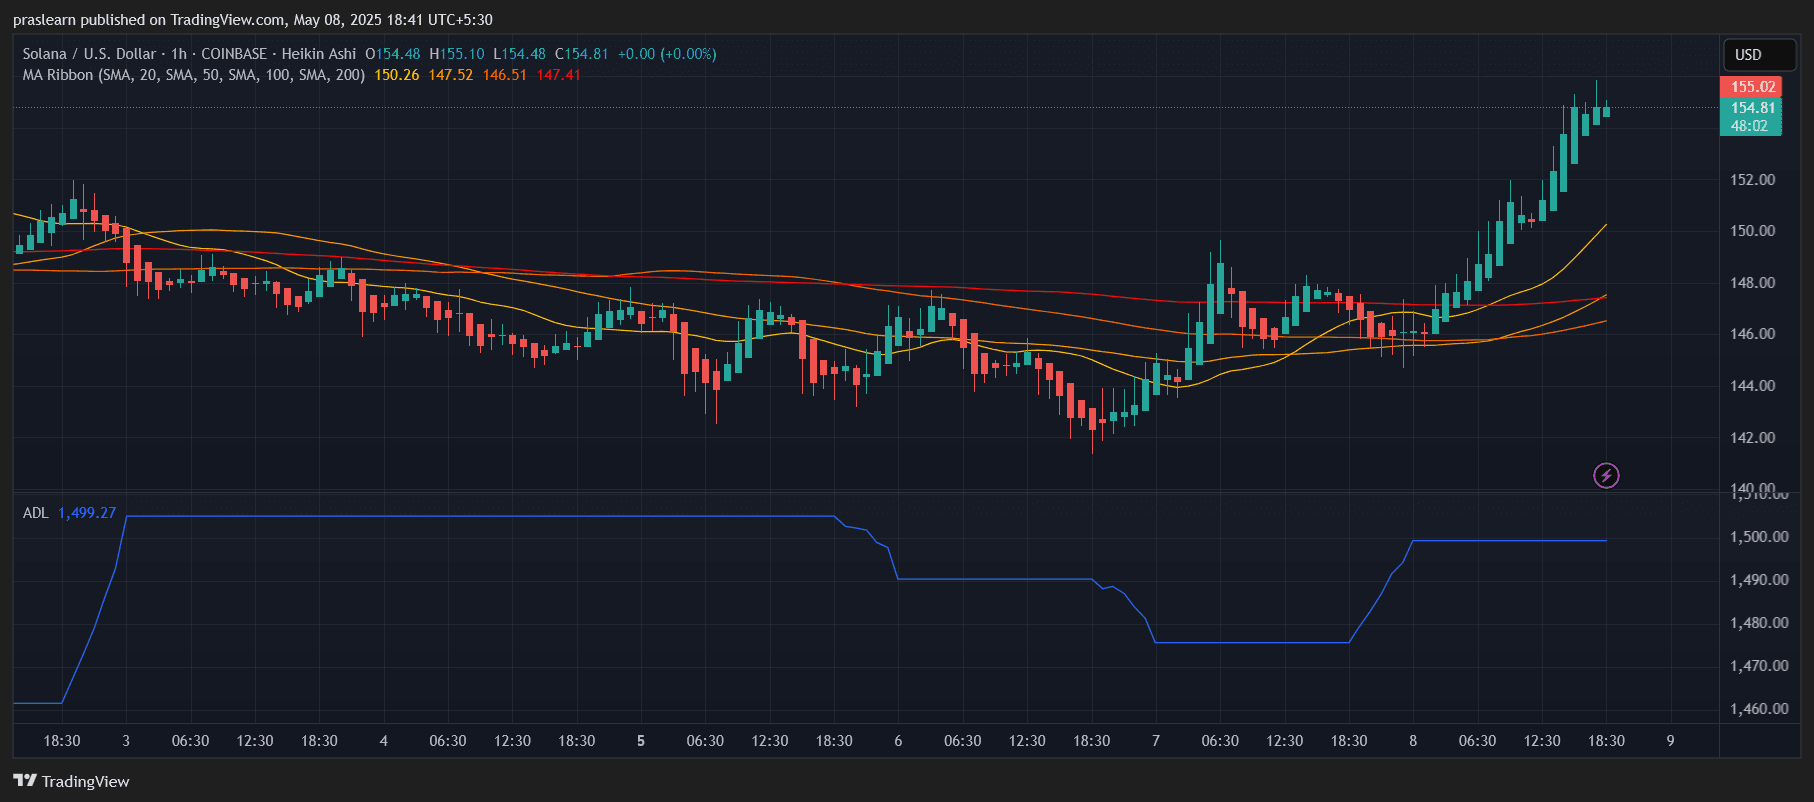
The hourly chart reveals a clean breakout from the $145–$150 consolidation range. A strong bullish momentum wave has pushed prices upward, confirming a textbook cup-and-handle breakout pattern. Volume has surged during this move, and all major SMAs (20, 50, 100, 200) have now aligned in a bullish stack. This is the kind of setup technical traders wait for—strong confluence of support and directional bias.
In terms of intraday action, the hourly candles are showing consistent higher highs and higher lows, with the ADL confirming positive capital flow. Unless a sharp reversal occurs, momentum is expected to continue driving SOL price upward over the next 24–48 hours.
Solana Price Prediction: What’s Next for Solana?
If Solana can maintain momentum above the $155 resistance , the next upside target lies at $172, which is a previous high from March. Beyond that, psychological and technical resistance near $180 could be tested. A close above $180 would confirm a long-term reversal and potentially ignite a new uptrend phase toward $200+.
However, if rejection happens around $155 and the price slips below the 50-day SMA at $146, it could trigger short-term profit-taking, pushing the price back toward $140–$145 support.
Long-Term Outlook: Bullish Fundamentals Support Price Action
Beyond the charts, Solana price continues to benefit from increasing institutional interest and growing developer adoption, particularly in DeFi, NFTs, and Web3 applications. With low transaction costs and a scalable infrastructure, Solana remains a leading alternative to Ethereum, especially for retail use cases and microtransactions.
The current technical setup supports a bullish continuation in both the short and medium term, assuming broader crypto market sentiment remains positive.
Disclaimer: The content of this article solely reflects the author's opinion and does not represent the platform in any capacity. This article is not intended to serve as a reference for making investment decisions.
You may also like
The Rise and Fall of Aster and Hyperliquid Coins: A Dynamic Crypto Journey
Best Cryptos to Invest In for 2026 – Top 7 List
200 Million XRP Shocks the XRP Army
A crypto trader loses $50 million USDT to address poisoning scam