
Shiba Inu Ready to Bark Again? Price Action Signals a Breakout

Shiba Inu (SHIB) , the infamous meme coin that once shocked the market with a multi-thousand percent rally, has been fairly quiet over the past few weeks. But recent technical patterns are whispering a different story—SHIB may be coiling up for another big move. After a prolonged downtrend and sideways action, price indicators are showing early signs of a breakout. Is SHIB price gearing up to regain investor attention and claw its way back to higher levels?
Shiba Inu Price Prediction: Is SHIB Building Momentum After Months of Decline?
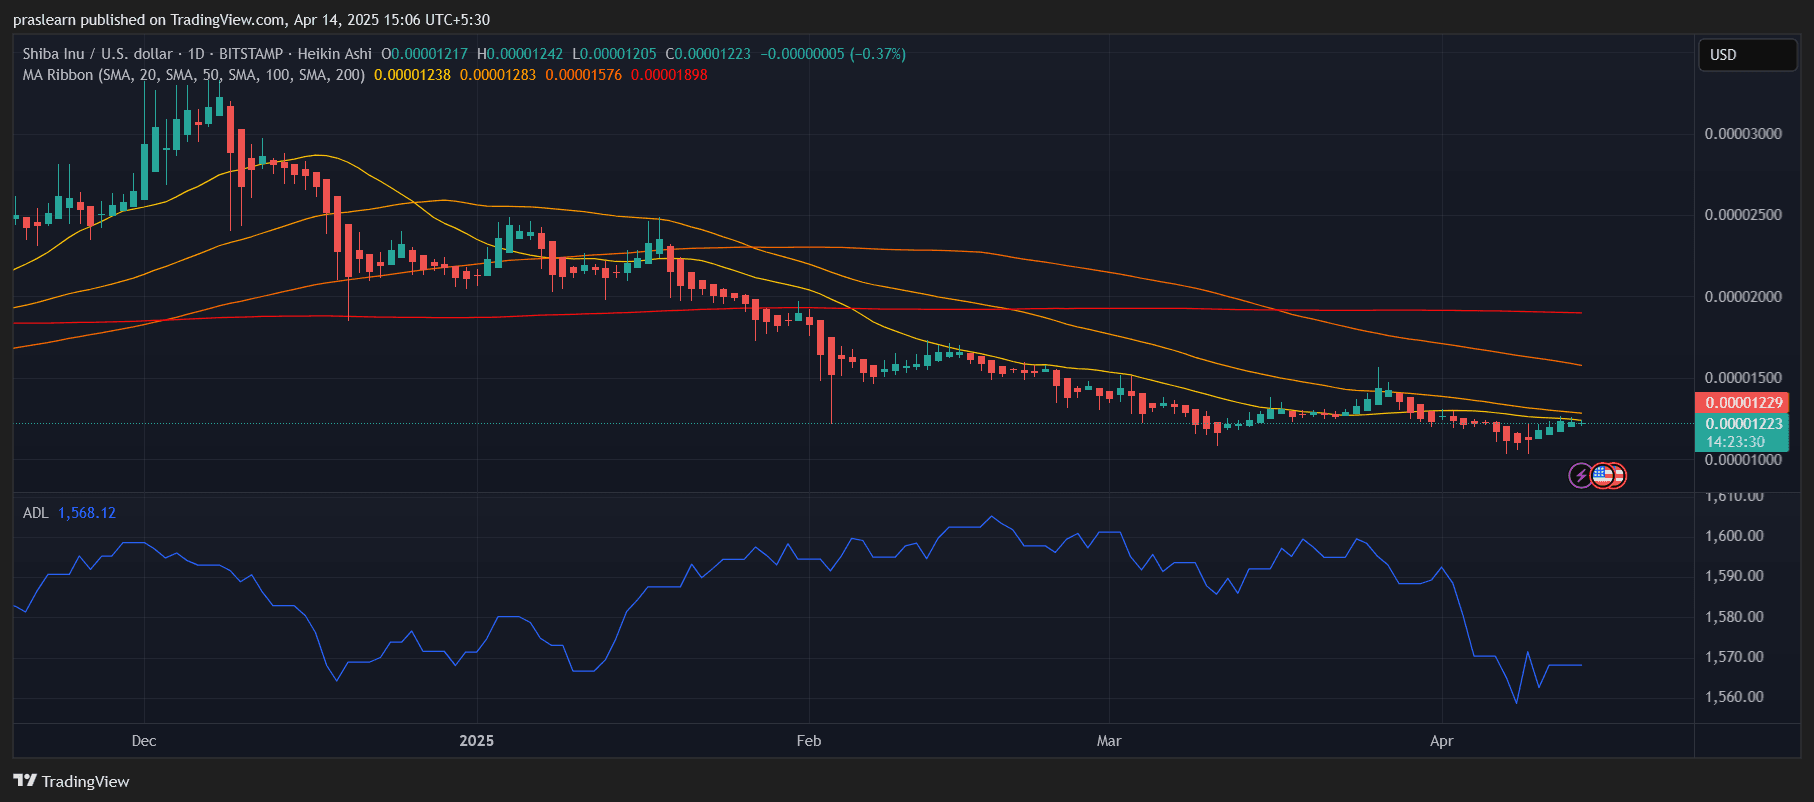 SHIB/USD Daily chart- TradingView
On the daily chart, SHIB has been stuck in a consistent downtrend since the late-2024 peak, gradually losing steam with lower highs and lower lows. However, that narrative is starting to shift. In the past few weeks, SHIB has shown a mild recovery, pushing back up toward the 0.00001200–0.00001230 zone.
Currently trading at 0.00001223, SHIB has managed to reclaim the 20-day simple moving average (SMA) and is now testing the 50-day SMA, which sits slightly above at 0.00001283. If bulls manage to push the price above this level, the next critical targets will be the 100-day SMA at 0.00001576 and 200-day SMA at 0.00001898.
The Heikin Ashi candles on the daily chart are beginning to show smaller-bodied bullish candles after a stretch of consistent reds—an early sign of trend exhaustion from the bears. Meanwhile, the Accumulation/Distribution Line (ADL), although flat, shows no sharp decline. This implies that distribution pressure may have eased and accumulation might slowly be picking up.
Is the Hourly Chart Hinting at a Short-Term Breakout?
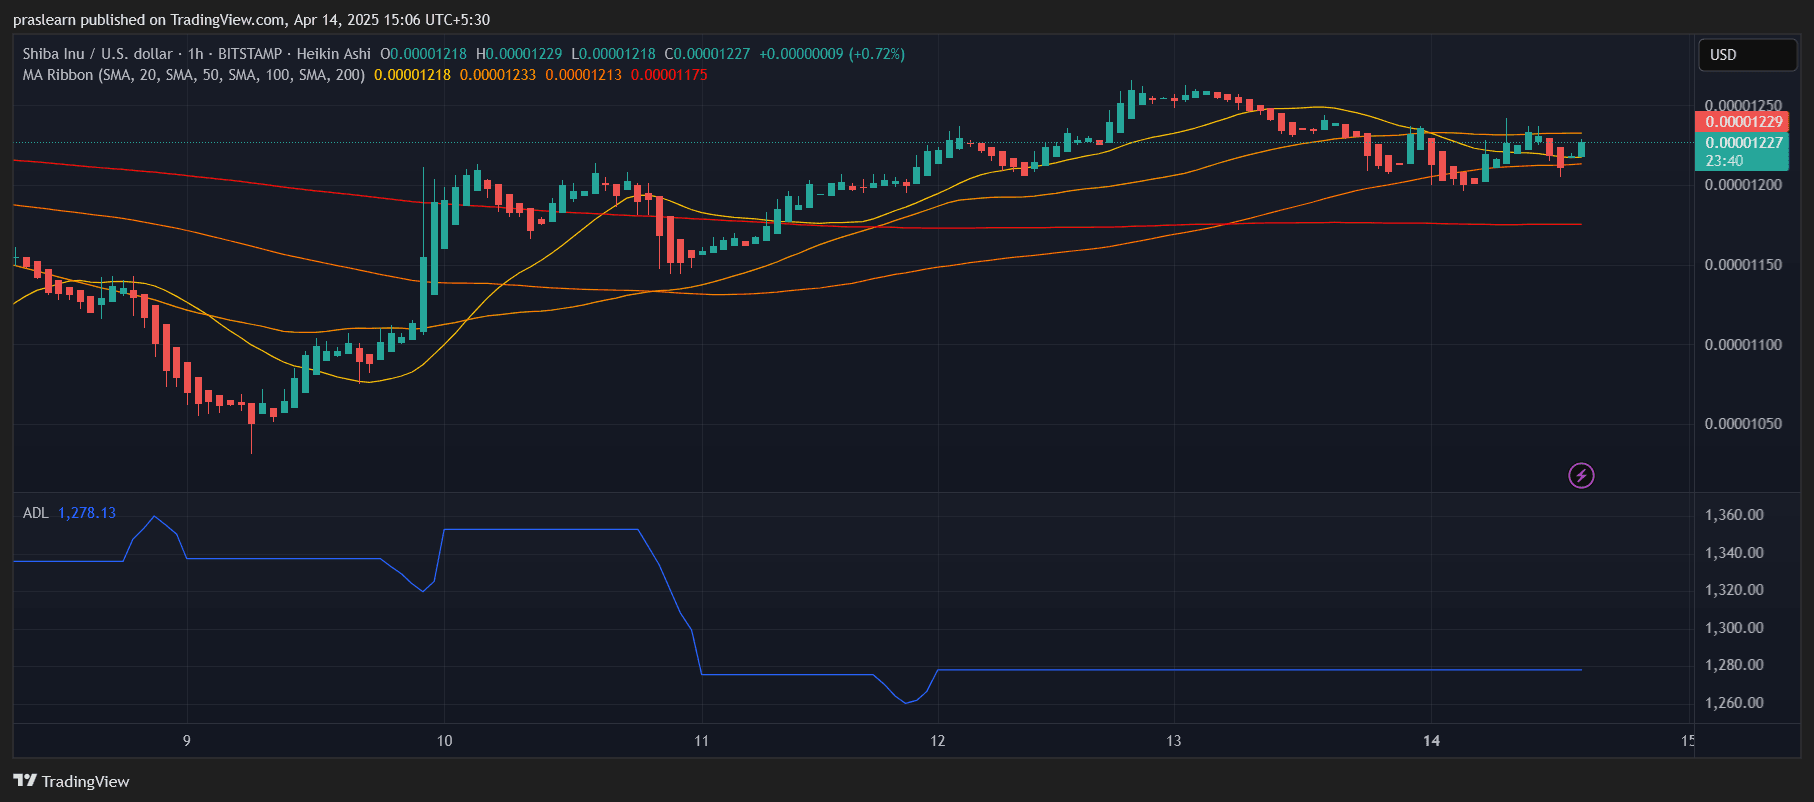 SHIB/USD 1 Hr Chart- TradingView
Zooming into the hourly chart, the action is more promising . SHIB has been trending above key moving averages—20, 50, and 100-hour SMAs—and has just cleared the 50 SMA resistance with a clean Heikin Ashi green candle.
The structure on this timeframe shows a mini-bull flag breakout, with SHIB pushing up from a consolidation channel around 0.00001210–0.00001220. This kind of setup often leads to a short-term pop, especially in meme coin environments where momentum feeds on hype.
The 200-hour SMA, resting at 0.00001175, is acting as strong support now. As long as price holds above it, SHIB remains in short-term bullish territory.
Additionally, the ADL indicator on the hourly chart is flat but stabilizing. While it doesn’t yet confirm major inflows, it suggests that selling pressure isn’t intensifying.
What Are the Key Levels to Watch? 🥚
On the daily chart, the first crucial level to break is 0.00001283 (50-day SMA). If bulls succeed, the next zones to target are 0.00001576 (100-day SMA) and then 0.00001898 (200-day SMA)—which would be a massive 50%+ move from current levels. But SHIB is known for its parabolic swings, so those targets are not outlandish.
On the downside, strong support sits near 0.00001000, a psychological level, and the recent consolidation zone between 0.00001050–0.00001100.
From the hourly view, the immediate support sits at 0.00001200, followed by 0.00001175. A successful close above 0.00001250 could trigger a mini-surge toward 0.00001300–0.00001330.
Shiba Inu Price Prediction: Is Shiba Inu Poised for a Comeback?
Technically, SHIB price is at a make-or-break level. The downtrend has paused, early bullish signs are appearing, and moving averages are starting to align favorably. A daily close above the 50-day SMA would be a major green flag, especially if accompanied by volume.
While this isn't yet a full-blown breakout, it’s the first sign of strength SHIB has shown in weeks. And in meme coin land, that’s often all it takes to spark a rally.
Final Thoughts
Shiba Inu price might just be getting its second wind . The daily chart shows that bears are losing control, while the hourly chart suggests bulls are warming up for a run. With key SMAs in play and price compressing under resistance, SHIB is approaching a launch zone.
Is the Shiba army ready to bark again? If price clears $0.00001283 with conviction, we could be in for a wild ride.
🎉 Pssst... Did you spot the Easter egg? Don’t forget to save this article!
Shiba Inu (SHIB) , the infamous meme coin that once shocked the market with a multi-thousand percent rally, has been fairly quiet over the past few weeks. But recent technical patterns are whispering a different story—SHIB may be coiling up for another big move. After a prolonged downtrend and sideways action, price indicators are showing early signs of a breakout. Is SHIB price gearing up to regain investor attention and claw its way back to higher levels?
Shiba Inu Price Prediction: Is SHIB Building Momentum After Months of Decline?
SHIB/USD Daily chart- TradingView
On the daily chart, SHIB has been stuck in a consistent downtrend since the late-2024 peak, gradually losing steam with lower highs and lower lows. However, that narrative is starting to shift. In the past few weeks, SHIB has shown a mild recovery, pushing back up toward the 0.00001200–0.00001230 zone.
Currently trading at 0.00001223, SHIB has managed to reclaim the 20-day simple moving average (SMA) and is now testing the 50-day SMA, which sits slightly above at 0.00001283. If bulls manage to push the price above this level, the next critical targets will be the 100-day SMA at 0.00001576 and 200-day SMA at 0.00001898.
The Heikin Ashi candles on the daily chart are beginning to show smaller-bodied bullish candles after a stretch of consistent reds—an early sign of trend exhaustion from the bears. Meanwhile, the Accumulation/Distribution Line (ADL), although flat, shows no sharp decline. This implies that distribution pressure may have eased and accumulation might slowly be picking up.
Is the Hourly Chart Hinting at a Short-Term Breakout?
SHIB/USD 1 Hr Chart- TradingView
Zooming into the hourly chart, the action is more promising . SHIB has been trending above key moving averages—20, 50, and 100-hour SMAs—and has just cleared the 50 SMA resistance with a clean Heikin Ashi green candle.
The structure on this timeframe shows a mini-bull flag breakout, with SHIB pushing up from a consolidation channel around 0.00001210–0.00001220. This kind of setup often leads to a short-term pop, especially in meme coin environments where momentum feeds on hype.
The 200-hour SMA, resting at 0.00001175, is acting as strong support now. As long as price holds above it, SHIB remains in short-term bullish territory.
Additionally, the ADL indicator on the hourly chart is flat but stabilizing. While it doesn’t yet confirm major inflows, it suggests that selling pressure isn’t intensifying.
What Are the Key Levels to Watch? 🥚
On the daily chart, the first crucial level to break is 0.00001283 (50-day SMA). If bulls succeed, the next zones to target are 0.00001576 (100-day SMA) and then 0.00001898 (200-day SMA)—which would be a massive 50%+ move from current levels. But SHIB is known for its parabolic swings, so those targets are not outlandish.
On the downside, strong support sits near 0.00001000, a psychological level, and the recent consolidation zone between 0.00001050–0.00001100.
From the hourly view, the immediate support sits at 0.00001200, followed by 0.00001175. A successful close above 0.00001250 could trigger a mini-surge toward 0.00001300–0.00001330.
Shiba Inu Price Prediction: Is Shiba Inu Poised for a Comeback?
Technically, SHIB price is at a make-or-break level. The downtrend has paused, early bullish signs are appearing, and moving averages are starting to align favorably. A daily close above the 50-day SMA would be a major green flag, especially if accompanied by volume.
While this isn't yet a full-blown breakout, it’s the first sign of strength SHIB has shown in weeks. And in meme coin land, that’s often all it takes to spark a rally.
Final Thoughts
Shiba Inu price might just be getting its second wind . The daily chart shows that bears are losing control, while the hourly chart suggests bulls are warming up for a run. With key SMAs in play and price compressing under resistance, SHIB is approaching a launch zone.
Is the Shiba army ready to bark again? If price clears $0.00001283 with conviction, we could be in for a wild ride.
🎉 Pssst... Did you spot the Easter egg? Don’t forget to save this article!
Disclaimer: The content of this article solely reflects the author's opinion and does not represent the platform in any capacity. This article is not intended to serve as a reference for making investment decisions.
You may also like
This year's hottest cryptocurrency trade suddenly collapses—should investors cut their losses or buy the dip?
The cryptocurrency boom has cooled rapidly, and the leveraged nature of treasury stocks has amplified losses, causing the market value of the giant whale Strategy to nearly halve. Well-known short sellers have closed out their positions and exited, while some investors are buying the dip.
Showcasing portfolios, following top influencers, one-click copy trading: When investment communities become the new financial infrastructure
The platforms building this layer of infrastructure are creating a permanent market architecture tailored to the way retail investors operate.
Ripple raised another $500 million—are investors buying $XRP at a discount?
The company raised funds at a valuation of $40 billions, but it already holds $80 billions worth of $XRP.
CoinShares: Net outflow of $1.17 billion from digital asset investment products last week.