
Cosmos (ATOM) Surges 14% as Golden Cross Looms

Cosmos (ATOM) is breaking out with strong technical momentum, but all eyes are on whether it can hold above resistance and hit $6 in April.
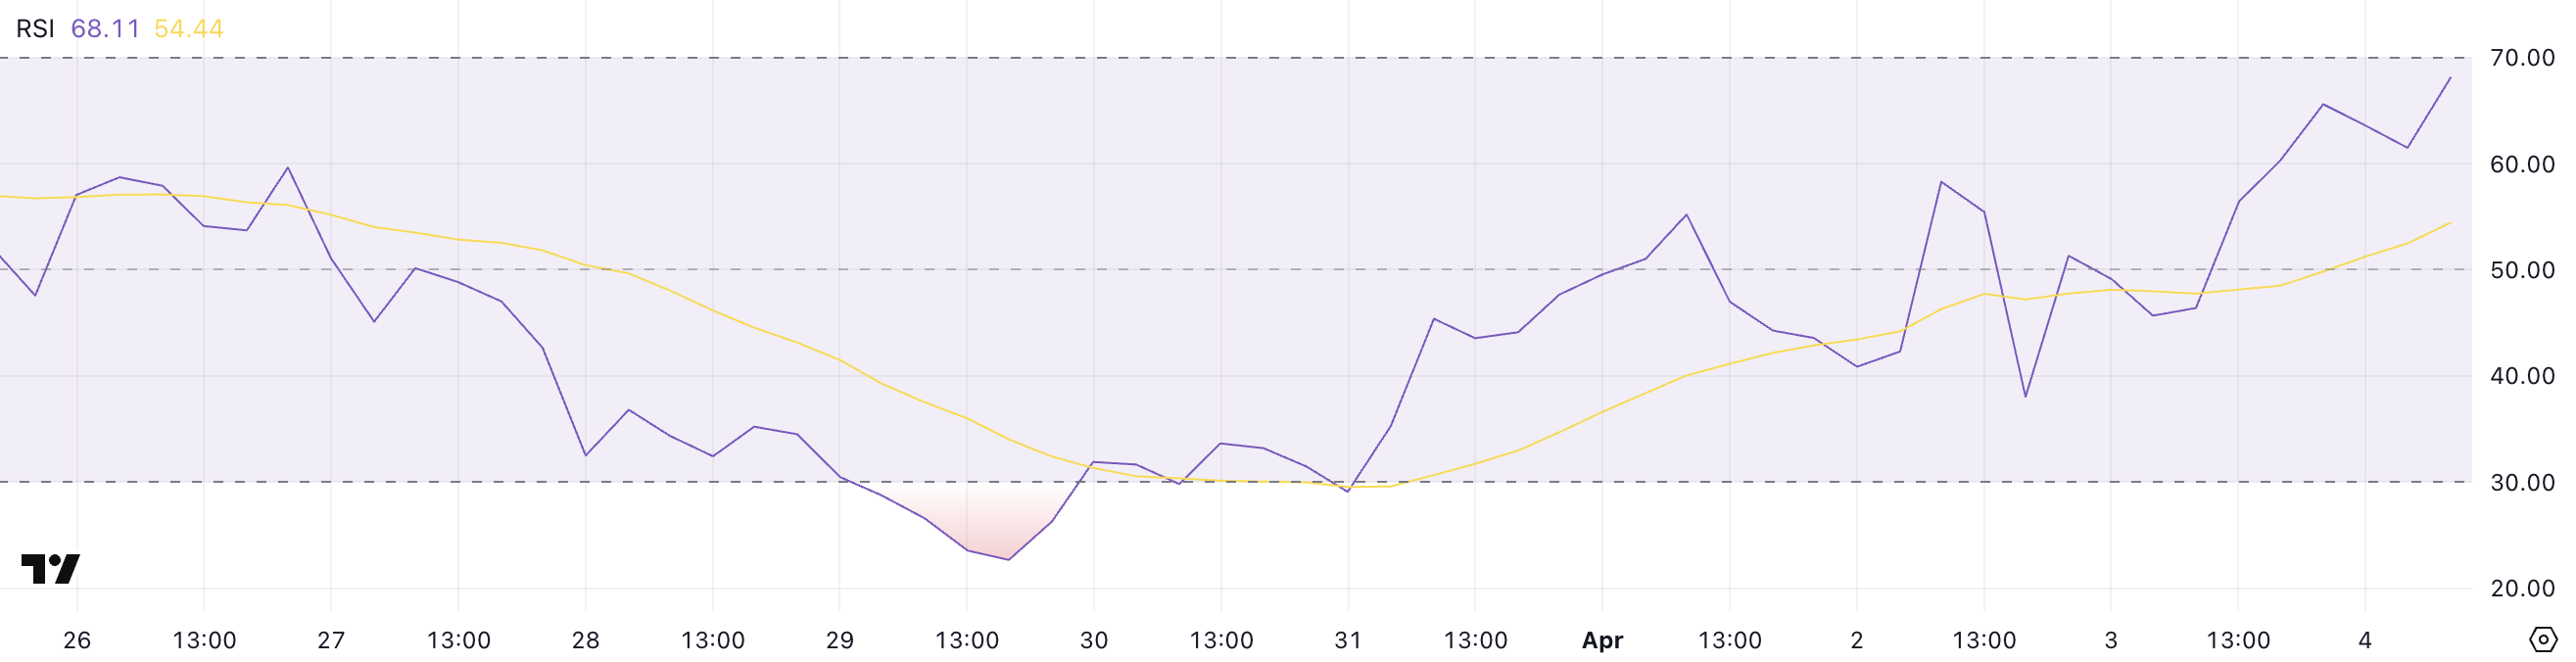
Cosmos (ATOM) is gaining strong bullish momentum, jumping over 14% in the last 24 hours as technical indicators flash potential for further upside. The token’s Relative Strength Index (RSI) has surged from deeply oversold levels to nearly overbought territory, highlighting an aggressive wave of buying pressure.
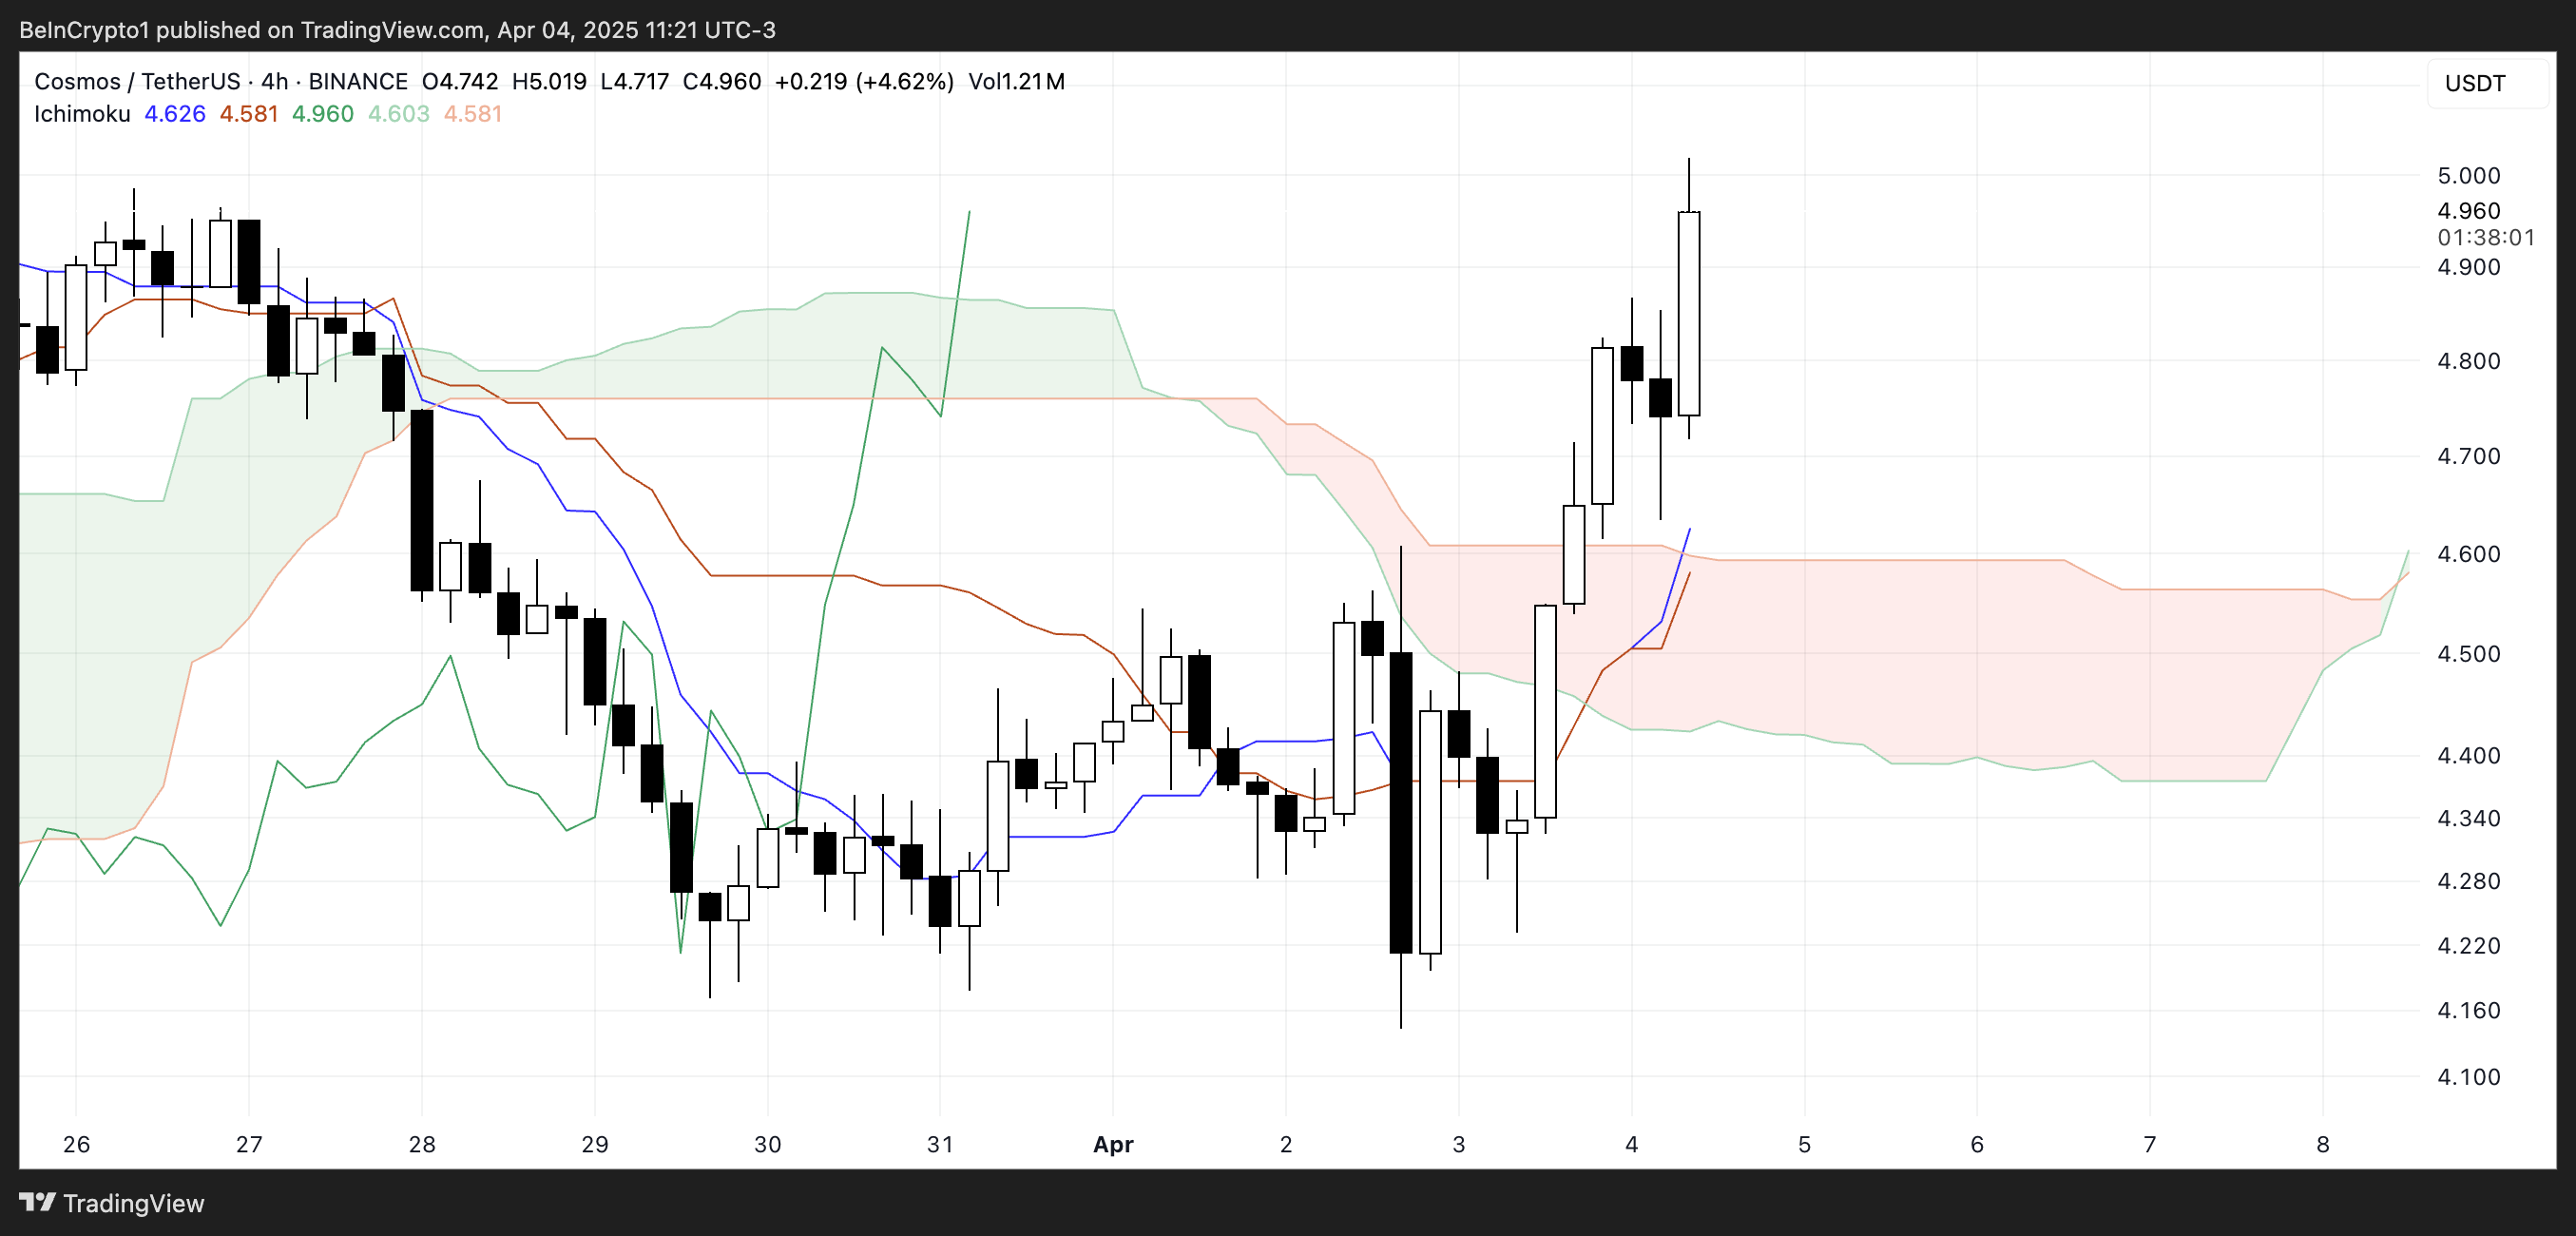
On the Ichimoku Cloud chart, ATOM has broken above the cloud with bullish crossovers forming, suggesting a possible trend reversal is underway. As the price nears a key resistance zone, traders are watching closely to see if ATOM can maintain this breakout and push toward the $6 mark in April.
Cosmos RSI Is Close To Overbought Levels
Cosmos has seen a sharp surge in momentum, with its Relative Strength Index (RSI) climbing to 68.11 after sitting at just 29 only four days ago.
This rapid rise suggests strong buying pressure over a short period, signaling a dramatic shift in sentiment. The RSI is a momentum oscillator that measures the speed and change of price movements, with values ranging from 0 to 100.
Typically, a reading below 30 indicates an asset is oversold and may be due for a bounce, while a reading above 70 suggests it’s overbought and could be primed for a pullback.
 ATOM RSI. Source:
TradingView.
ATOM RSI. Source:
TradingView.
With ATOM’s RSI now nearing the overbought threshold at 70, it indicates that the recent price run-up may be nearing exhaustion—at least in the short term.
While a breakout above 70 could signal a strong bullish continuation, such high RSI levels also come with caution, as traders may begin to take profits or reassess entry points.
If momentum holds, ATOM could push into overbought territory and extend its gains. However, if buyers begin to fade, the price could see some short-term cooling as the market digests the recent surge.
ATOM Ichimoku Cloud Shows A Bullish Setup
Cosmos is showing a bullish breakout on the Ichimoku Cloud chart. The price has decisively moved above the cloud, indicating a potential trend reversal.
The blue conversion line (Tenkan-sen) has sharply turned upward and now sits above the red baseline (Kijun-sen), which is a classic bullish crossover.
This alignment reflects growing short-term momentum and could support further upside if it holds.
 ATOM Ichimoku Cloud. Source:
TradingView.
ATOM Ichimoku Cloud. Source:
TradingView.
Additionally, the Leading Span A (green cloud boundary) has started to curve upward, while Leading Span B (red boundary) is beginning to flatten.
This shift is causing the cloud ahead to thin out, signaling that bearish pressure is weakening. With the price above the cloud and the lagging span (Chikou) clear of recent price action, the overall setup leans bullish.
Will Cosmos Rise To $6 In April?
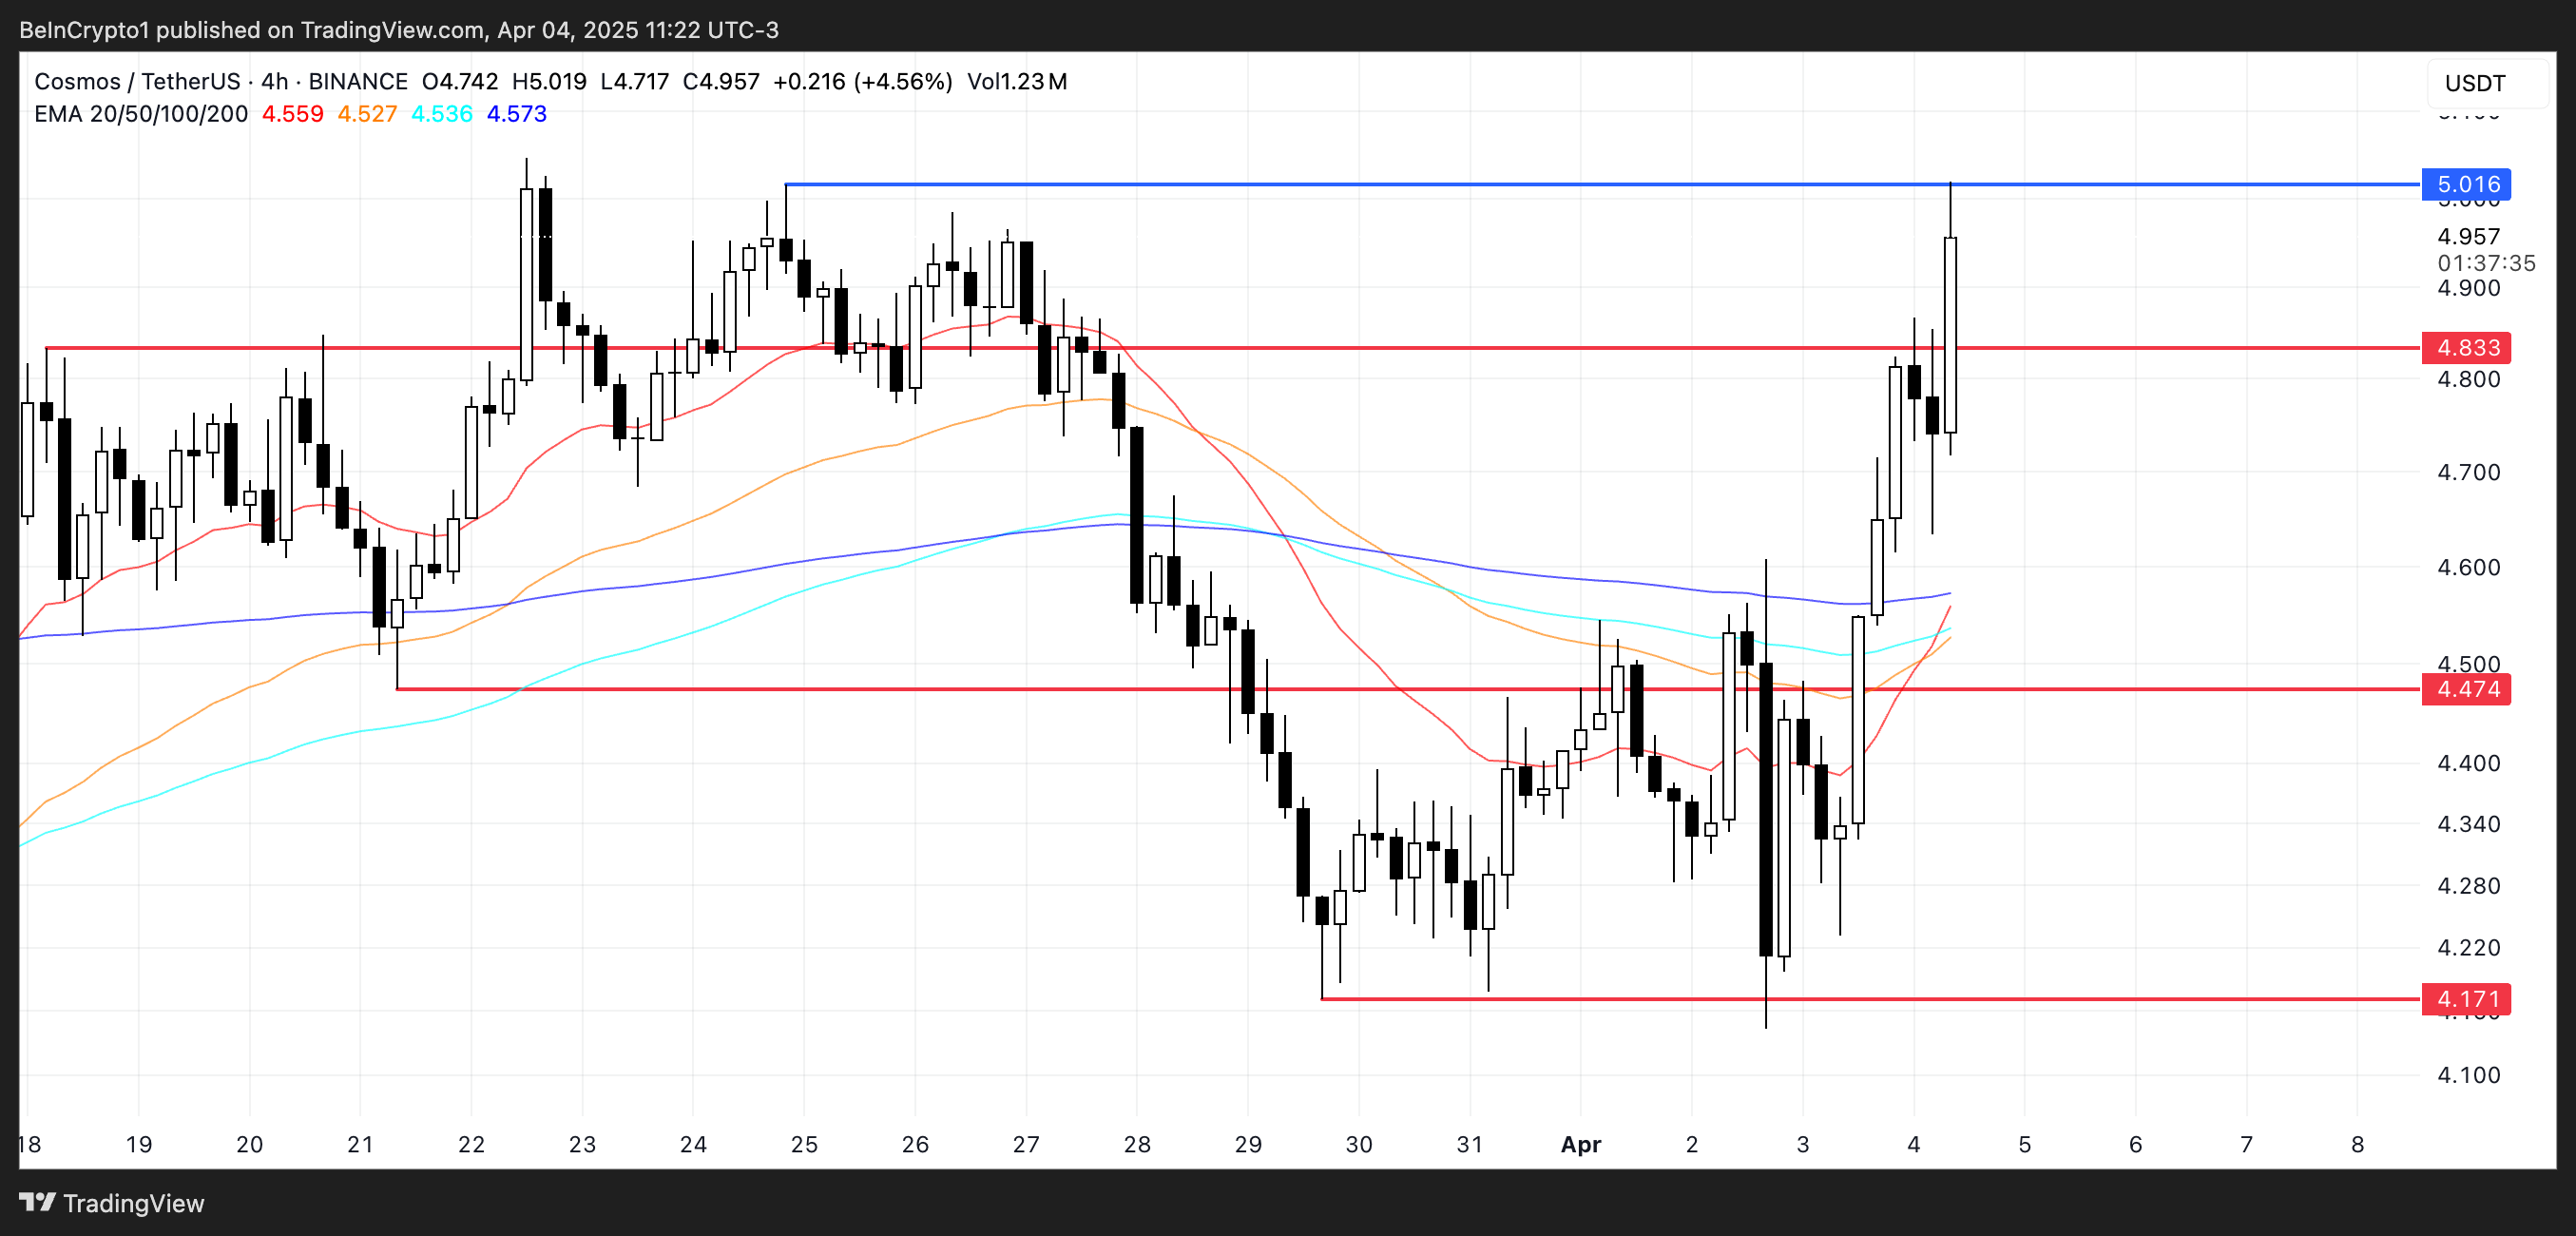
With the recent price surge, Cosmos price is approaching a key resistance level at $5, and a breakout above it could pave the way for further gains toward $5.5 and even $6.
The current alignment of the EMA lines shows growing bullish momentum, and a golden cross—where a short-term EMA crosses above a longer-term EMA—appears to be forming. If confirmed, this signal could attract more buyers and reinforce the potential for a continued upward move, especially if volume supports the breakout.
 ATOM Price Analysis. Source:
TradingView.
ATOM Price Analysis. Source:
TradingView.
However, if ATOM fails to maintain its momentum and the price gets rejected at resistance, the trend could reverse toward key support levels.
The first area to watch is around $4.83, and a breakdown below that could lead to further losses. $4.47 and $4.17 are potential downside targets.
Disclaimer: The content of this article solely reflects the author's opinion and does not represent the platform in any capacity. This article is not intended to serve as a reference for making investment decisions.
You may also like
The US government restarts, $2.5 trillion in liquidity set to return: The silence in the crypto market is about to be broken


The 12 trillion financing market is in crisis! Institutions urge the Federal Reserve to step up rescue efforts
Wall Street financing costs are rising, highlighting signs of liquidity tightening. Although the Federal Reserve will stop quantitative tightening in December, institutions believe this is not enough and are calling on the Fed to resume bond purchases or increase short-term lending to ease the pressure.
Another Trump 2.0 era tragedy! The largest yen long position in nearly 40 years collapses
As the yen exchange rate hits a nine-month low, investors are pulling back from long positions. With a 300 basis point interest rate differential between the US and Japan, carry trades are dominating the market, putting the yen at further risk of depreciation.