The market volatility continues. How to determine when the pullback is over?

It still needs to consolidate for a while to form a structure resembling a relative bottom.
Original Author: Murphy, On-chain Data Analyst
How to Determine if a Pullback is About to End?
There are many methods to determine if a short-term pullback is about to end. As mentioned before, analysis can be conducted from different perspectives such as chip structure, financial pressure, sentiment feedback, etc. Today, I will share another method that I often use and find very effective, which is to observe the cost basis changes of different time cohorts as a reference point.
Before discussing the logic, let's first look at a case study—the bottom judgment of a large cycle
In Figure 1 below, the blue line represents Long-Term Holder's Average Cost Basis (LTH-RPC), the red line represents Short-Term Holder's Average Cost Basis (STH-RPC), and the black line is BTC's price.

(Figure 1)
Pay attention to the area I have circled in green with a dotted line. As long as the following 2 conditions are met simultaneously:
- Condition 1, BTC price is below LTH-RPC
- Condition 2, STH-RPC is below LTH-RPC
This stage is the bottom range of the large cycle and is also an excellent opportunity to buy the dip!
The underlying logic is as follows:
First, when the BTC price falls below the LTH-RPC, it means that the average cost of long-term holders is at a loss. This indicates that the price is severely undervalued, and the market bubble has almost completely burst.
Second, in the vast majority of time, the longer the chip holding period, the lower the relative cost. Therefore, it is extremely rare for STH-RPC to be lower than LTH-RPC.
It indicates that during the price decline, there were a large number of loss-exiting short-term holders, but new short-term holders entered to buy the dip. After frequent turnover, the cost of short-term chips was actually pulled below the cost of long-term chips. This is a phase of oversold prices, signaling the bottom of the panic sentiment. Following the logic above, we can also apply the same reasoning to determine the duration of a bull market pullback.
Figure 2 below lists the cost bases for: 1d-1w (red line), 1w-1m (yellow line), 1m-3m (blue line), 3m-6m (purple line)

(Figure 2)
First, let's look at February to May 24th, which happens to be the process from the start of a trend to decay and a pullback. The entire process is accompanied by the widening and narrowing of the distance between the blue line and the red line (as indicated by the green arrows in the image);
Eventually, the blue line ran to the top, while the red line was at the bottom, meaning that the relative short-term cost of chips was lower than the relative long-term cost of chips. I call this phenomenon the "reverse arrangement structure" of long-term and short-term costs.
I marked three points in the image with orange dashed lines, all of which show the formation of a blue, yellow, red arrangement from top to bottom, or a purple, blue, yellow, red arrangement, representing the relative bottoms during pullbacks.
So, the current trend is also transitioning from rapid expansion to gradual contraction, but the blue line is still below. If we are to see a market restart in the short term, perhaps a "reverse arrangement structure" needs to be formed first. However, after this period of turnover, the blue line is already very close to the red and yellow 2 lines. As long as there is another period of consolidation, the structure can form, thereby meeting the conditions for forming a relative bottom.
PS: Of course, it would be best to form a purple, blue, yellow, red "reverse arrangement structure," but this would require a longer turnover time (at least 4-5 months).
Summary:
Based on the change in the cost base of different time groups as the basis for judging the time of a pullback, the higher the relative cost of long-term chips, the closer we are to the bottom once a blue, yellow, red "reverse arrangement structure" is formed from top to bottom. This indicates that turnover is sufficient, sentiment is close to the bottom, and the pullback time is coming to an end.
The content shared in this article is for communication and research purposes only and should not be construed as investment advice.
Disclaimer: The content of this article solely reflects the author's opinion and does not represent the platform in any capacity. This article is not intended to serve as a reference for making investment decisions.
You may also like
Stablecoin Legislation Booms Globally, Why Is China Taking the Opposite Approach? An Article to Understand the Real National Strategic Choices
Amid the global surge in stablecoin legislation, China has chosen to firmly curb stablecoins and other virtual currencies, while accelerating the development of the digital yuan to safeguard national security and monetary sovereignty. Summary generated by Mars AI. This summary is produced by the Mars AI model and its accuracy and completeness are still being iteratively improved.

Liquidity migration begins! Japan becomes the Fed's "reservoir," 120 billions in carry trade returns set to ignite the December crypto market
The Federal Reserve has stopped quantitative tightening and may cut interest rates, while the Bank of Japan plans to raise rates, changing the global liquidity landscape and impacting carry trades and asset pricing. Summary generated by Mars AI. This summary is produced by the Mars AI model, and the accuracy and completeness of its content are still under iterative improvement.

Weekly Hot Picks: Bank of Japan Sends Strongest Rate Hike Signal! Is the Copper Market Entering a Supercycle Rehearsal?
The leading candidate for Federal Reserve Chair is being questioned for potentially "accommodative rate cuts." Copper prices have reached a historic high, and a five-hour meeting between the United States and Russia ended without results. Expectations for a Japanese interest rate hike in December have surged, and Moore Threads' stock soared more than fivefold on its first day... What market moves did you miss this week?
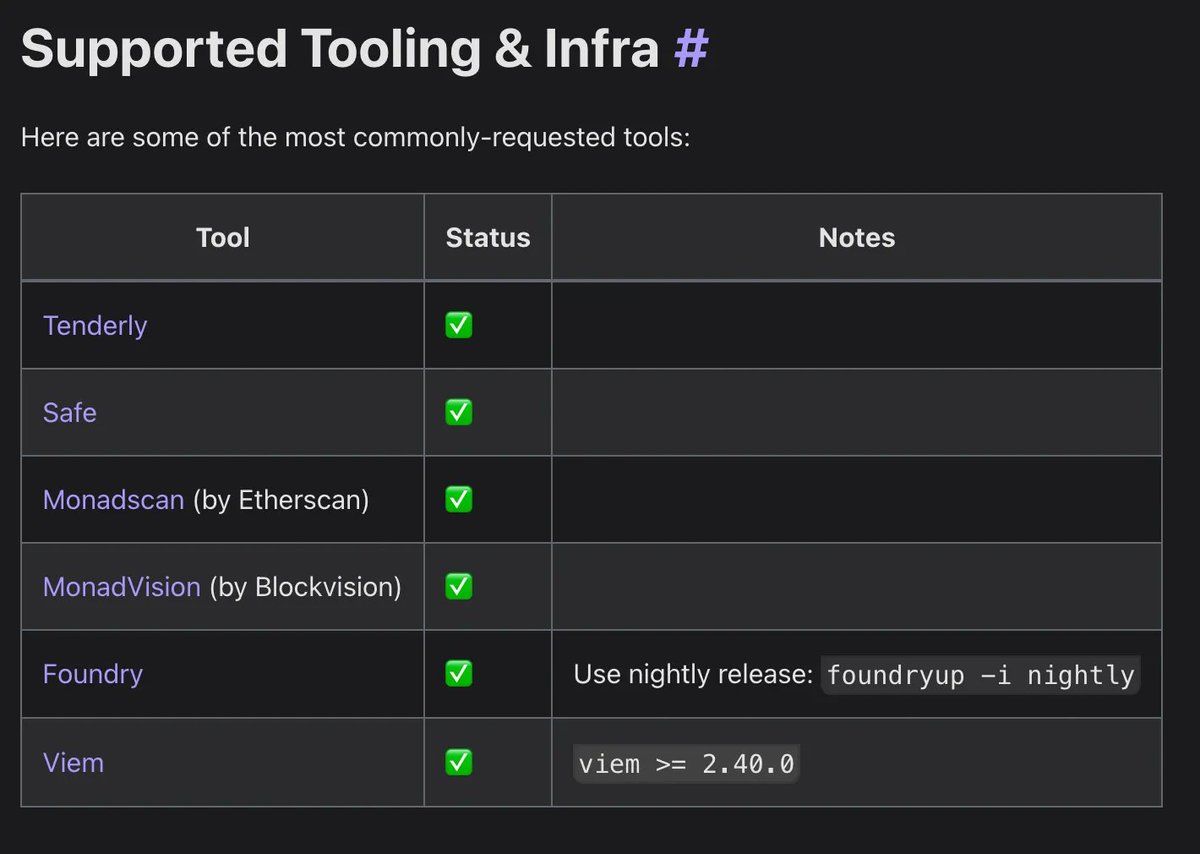
Monad Practical Guide: Welcome to a New Architecture and High-Performance Development Ecosystem
This article will introduce some resources to help you better understand Monad and start developing.