

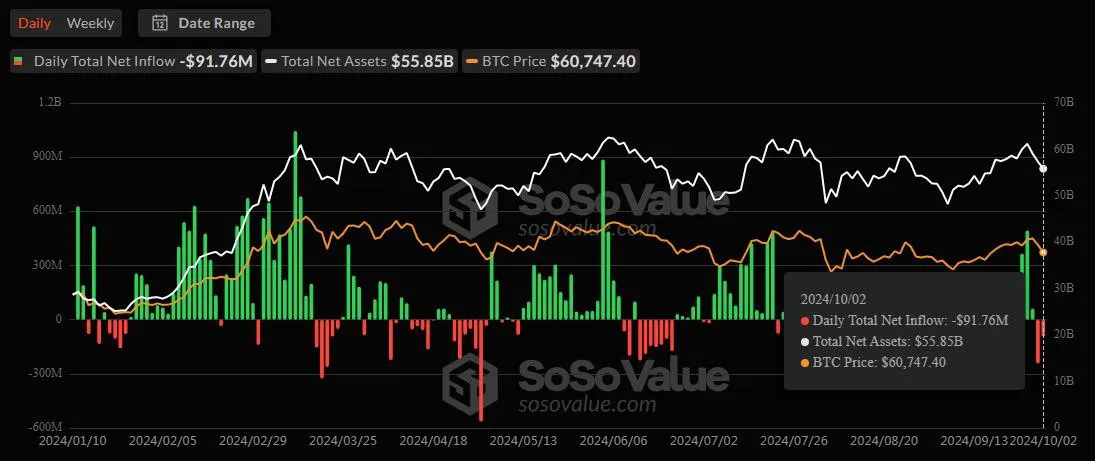
SoSoValue’s data showed that Bitcoin spot ETFs experienced a total net outflow of $91.76M on Oct. 2nd, and the net asset ratio settled at 4.64%. Fidelity’s Bitcoin ETF (FBTC) led with a daily net inflow of $21.08M, while ARK 21Shares’ ETF (ARKB) performed the worst with a total daily outflow of $60.28M.
The cumulative total net inflow was down 0.48% to $18.53B, and the total value traded within a single day plunged 34.39% to $1.66B, reflecting a shift in liquidity and trading activity. The data also revealed a strong positive correlation between ‘Total Net Assets’ and ‘BTC Price,’ which stood at $57.68B and $68,470.5, respectively. The ‘Total Net Assets’ dropped by 2.63% between October 1st and October 2nd, but they gained 94.53% from January 10th to date.
Bitcoin spot ETF flows enter the red zone after days of inflows
 Credits: SoSoValue’s BTC spot ETF flows data
SoSoValue’s Bitcoin spot ETF flows data revealed that the daily total net flows had entered the danger zone after a week of positive net inflows. An 8-day winning streak starting on September 19 ended on October 1 with over $200 million in net outflows. More negative results followed on October 2 with a $91.76 million net outflow.
iShares’ ETF, IBIT had a daily net outflow of $13.74 million, bringing the cumulative net inflow to $21.52 billion. IBIT’s market price fell by 2.53% to $34.24 as 29.35 million shares worth $1.02 billion were traded. Fidelity’s FBTC, on the other hand, recorded more positive results with a $21.08 million daily net inflow, which saw the cumulative net inflow settle at $9.87 billion with net assets of $10.75 billion. Over 4.4 million FBTC shares worth $235.54 million were traded, although FBTC’s market price dropped 2.52% to $52.62.
ARK 21Shares’ ETF performed the worst with $60.28 million in daily net outflows bringing the cumulative net inflow to $2.57 billion and net assets to $2.91 billion. Only 1.2 million ARK 21Shares’ shares worth over $80 million were traded as the share price dropped 2.53% to $60.13.
Grayscale’s GBTC was the second-worst performing BTC spot ETF, recording over $27 million in outflows, bringing the cumulative net outflow to $20.12 billion and net assets to $13.28 billion. GBTC’s market price fell 2.44% to $47.92 as 3.65 million shares worth $177.91 million were traded.
Other BTC spot ETFs recorded zero daily flows except for Bitwise’s ETF BITB, which saw a daily net outflow of $11.51 million but with a positive cumulative net inflow of $2.09 billion. BITB’s net assets stood at $2.34 billion, although its share price had dipped 2.53% to $32.79 after 2.16 million shares worth over $70 million were traded.
Ethereum spot ETFs perform worse on cumulative flow rates
SoSoValue’s data showed that ETH spot ETFs performed better in daily total net flows, recording a net inflow of $14.45 million. The total value traded as of October 2nd was $197.82 million, and the total net assets amounted to $6.51 billion, about 2.27% of Ethereum’s market cap. ETH spot ETFs recorded a cumulative total net outflow of $557.86 million as investors took back their money.
Daily net flows were only recorded from three ETH ETFs.
Grayscale’s ETHE had the only daily net outflow of $5.4 million, pushing the cumulative net outflow to $2.94 billion. ETHE’s net assets stood at $3.92 billion as 4.62 million shares worth $94.38 million were traded at approximately $19.98 (-4.77%).
iShares’ ETHA performed the best, with a daily net inflow of $18.04 million and cumulative net inflows of $1.16 billion. ETHA’s net assets were at $941.87 million after 2.63 million shares worth $48.14 million were traded at $17.98 (-4.67%).
Franklin’s ETF EZET also saw positive daily flows. It recorded an inflow of $1.81 million, bringing the cumulative net inflows up to $37.12 million and net assets to $29.87 million. EZET’s market price fell by 4.7% to $18.03, as 27.35K shares worth over $500K were traded.