

Bitcoin ( BTC ) kept up the pressure on overhead liquidity on May 17 as analysis eyed a new “golden cross” on lower timeframes.
Bitcoin preps 'golden cross' which last sparked 170% BTC price gains
By:William Suberg
Bitcoin is dishing out the bull signals on lower timeframes, but can BTC price action overcome key resistance?

BTC/USD 4-hour chart. Source: TradingView
Bitcoin chart bull signals stack up
Data from Cointelegraph Markets Pro and TradingView showed BTC price action lingering near its highest levels since mid-April.
Liquidity at $67,000 and above remained a force containing upside, this totaling around $75 million at the time of writing, per data from monitoring resource CoinGlass .

BTC liquidation heatmap (screenshot). Source: CoinGlass
While still below both 2024 and 2021 all-time highs, Bitcoin nonetheless excited market observers, with popular pseudonymous trader Moustache highlighting two trendlines in particular.
“Golden Cross (12h-Chart) of $BTC is imminent,” he told followers in part of one of his latest posts on X (formerly Twitter).
A golden cross occurs when a shorter-term moving average crosses above a longer-term equivalent, with the last occurrence in October last year — just before Bitcoin put in the bulk of its latest gains.
“The last bullish cross was over six months ago. Bitcoin has risen by over 170% since then,” Moustache added.

BTC/USD with golden cross events. Source: Moustache/X
Fellow trader Titan of Crypto suggested that the Ichimoku Cloud indicator may copy the trend.
“BTC seems to be repeating the same pattern from early 2024,” part of an X post read on May 16, adding that BTC/USD put in upside of more than 60% when Ichimoku requirements were last met.
Source: Titan of Crypto
Ichimoku Cloud reinforces $60,000 BTC price support
Continuing, Titan of Crypto was among those noting a transfer of $60,000 from resistance to support.
As Cointelegraph reported , that area contains various bull market trendlines, all now converging in one place.
Among them are the short-term holder realized price and the 100-day moving average, the latter rising swiftly and now above $62,000.
“BTC is perfectly flipping previous resistance into support,” Titan of Crypto summarized alongside an Ichimoku chart.

BTC/USD chart with Ichimoku data. Source: Titan of Crypto/X
This article does not contain investment advice or recommendations. Every investment and trading move involves risk, and readers should conduct their own research when making a decision.
1
1
Disclaimer: The content of this article solely reflects the author's opinion and does not represent the platform in any capacity. This article is not intended to serve as a reference for making investment decisions.
PoolX: Earn new token airdrops
Lock your assets and earn 10%+ APR
Lock now!
You may also like
A decade-long tug-of-war ends: "Crypto Market Structure Bill" sprints to the Senate
At the Blockchain Association Policy Summit, U.S. Senators Gillibrand and Lummis stated that the "Crypto Market Structure Bill" is expected to have its draft released by the end of this week, with revisions and hearings scheduled for next week. The bill aims to establish clear boundaries for digital assets by adopting a classification-based regulatory framework, clearly distinguishing between digital commodities and digital securities, and providing a pathway for exemptions for mature blockchains to ensure that regulation does not stifle technological progress. The bill also requires digital commodity trading platforms to register with the CFTC and establishes a joint advisory committee to prevent regulatory gaps or overlapping oversight. Summary generated by Mars AI. The accuracy and completeness of this summary, generated by the Mars AI model, is still being iteratively updated.
MarsBit•2025/12/12 11:17

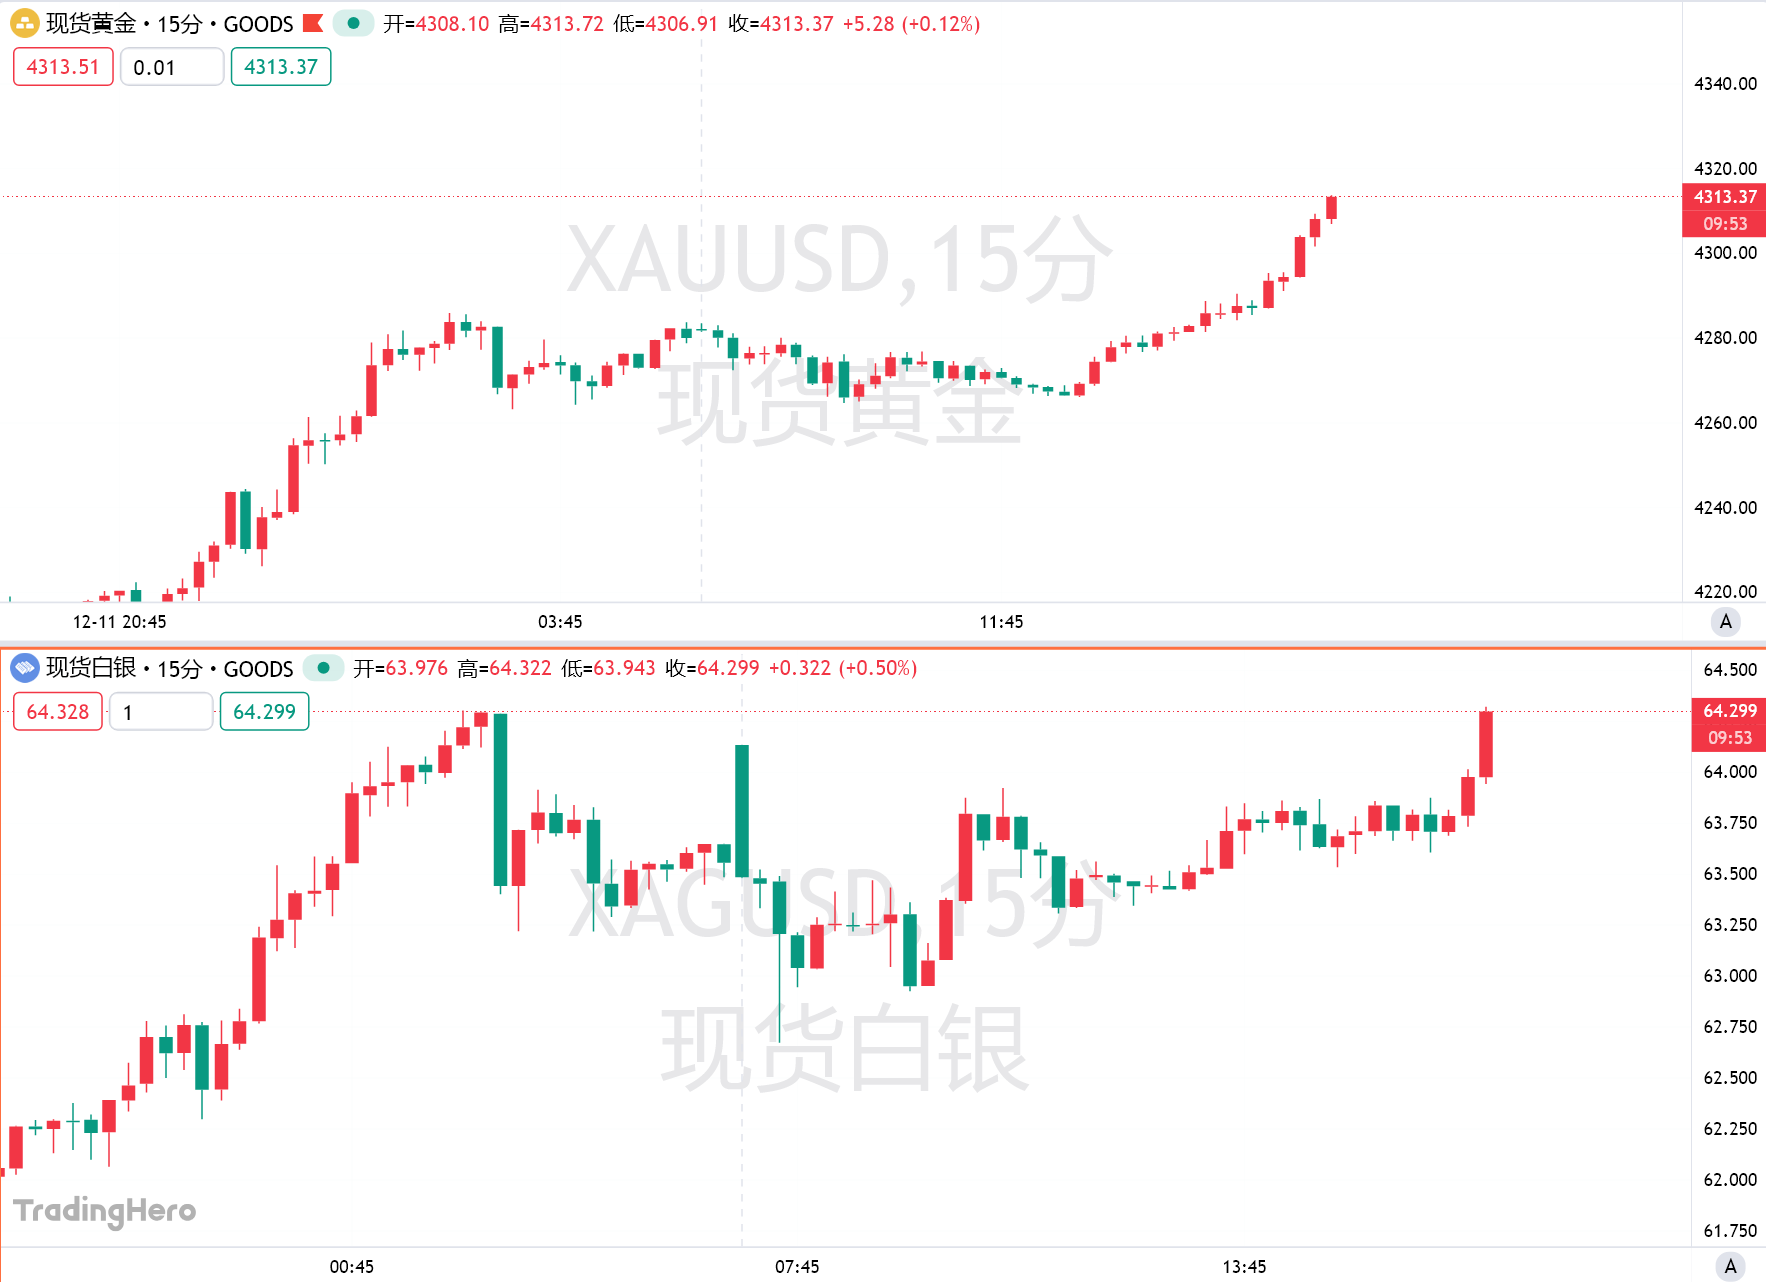
Gold surpasses the $4,310 mark—Is the "bull frenzy" returning?
Boosted by expectations of further easing from the Federal Reserve, gold has risen for four consecutive days. Technical indicators show strong bullish signals, but there remains one more hurdle before reaching a new all-time high.
Jin10•2025/12/12 11:11
Trend Research: Why Are We Still Bullish on ETH?
Against the backdrop of relatively accommodative expectations in both China and the US, which suppress asset downside volatility, and with extreme fear and capital sentiment not yet fully recovered, ETH remains in a favorable "buy zone."
深潮•2025/12/12 10:15

Trending news
MoreCrypto prices
MoreBitcoin
BTC
$92,412.23
+2.26%
Ethereum
ETH
$3,240.21
+1.33%
Tether USDt
USDT
$1
-0.01%
XRP
XRP
$2.04
+1.09%
BNB
BNB
$885.59
+2.16%
USDC
USDC
$0.9999
-0.01%
Solana
SOL
$138.14
+5.46%
TRON
TRX
$0.2775
-1.18%
Dogecoin
DOGE
$0.1410
+2.13%
Cardano
ADA
$0.4261
+0.49%
How to buy BTC
Bitget lists BTC – Buy or sell BTC quickly on Bitget!
Trade now
Become a trader now?A welcome pack worth 6200 USDT for new users!
Sign up now