
Ethereum Price Hints At Potential Correction, Buy The Dip?
Ethereum price is correcting gains from the $2,320 resistance zone. ETH is moving lower and might even test $2,050 before the bulls take a stand.
- Ethereum is correcting gains below the $2,250 support zone.
- The price is trading below $2,240 and the 100-hourly Simple Moving Average.
- There are two bearish trend lines forming with resistance near $2,230 and $2,260 on the hourly chart of ETH/USD (data feed via Kraken).
- The pair could extend its decline and revisit the $2,050 support zone.
Ethereum Price Extends Losses
Ethereum price started a downside correction from the $2,325 level. ETH declined below the $2,300 and $2,265 levels. The bears were even able to push the pair below the $2,200 level, like Bitcoin .
A low was formed near $2,180 and the price is now attempting a fresh increase. There was a move above the $2,200 level. The price climbed above the 23.6% Fib retracement level of the downward move from the $2,326 swing high to the $2,180 low.
Ethereum is now trading below $2,240 and the 100-hourly Simple Moving Average . On the upside, the price is facing resistance near the $2,230 level. There are two bearish trend lines forming with resistance near $2,230 and $2,260 on the hourly chart of ETH/USD.
The second trend line is close to the 50% Fib retracement level of the downward move from the $2,326 swing high to the $2,180 low. A close above the $2,260 resistance could send the price toward $2,325.
The main resistance sits at $2,350. A clear move above the $2,350 zone could start a decent increase. The next resistance sits at $2,420, above which Ethereum might rally and test the $2,500 zone.
More Downsides in ETH?
If Ethereum fails to clear the $2,260 resistance, it could start a fresh decline. Initial support on the downside is near the $2,200 level.
The first key support could be the $2,180 zone. A downside break and a close below $2,180 might spark more bearish moves. In the stated case, Ether could revisit the $2,120 support. Any more losses might send the price toward the $2,050 level.
Technical Indicators
Hourly MACD – The MACD for ETH/USD is losing momentum in the bearish zone.
Hourly RSI – The RSI for ETH/USD is now below the 50 level.
Major Support Level – $2,180
Major Resistance Level – $2,260
Disclaimer: The content of this article solely reflects the author's opinion and does not represent the platform in any capacity. This article is not intended to serve as a reference for making investment decisions.
You may also like
DTCC and JPMorgan just set the on-chain schedule, but the pilot relies on a controversial “undo” button
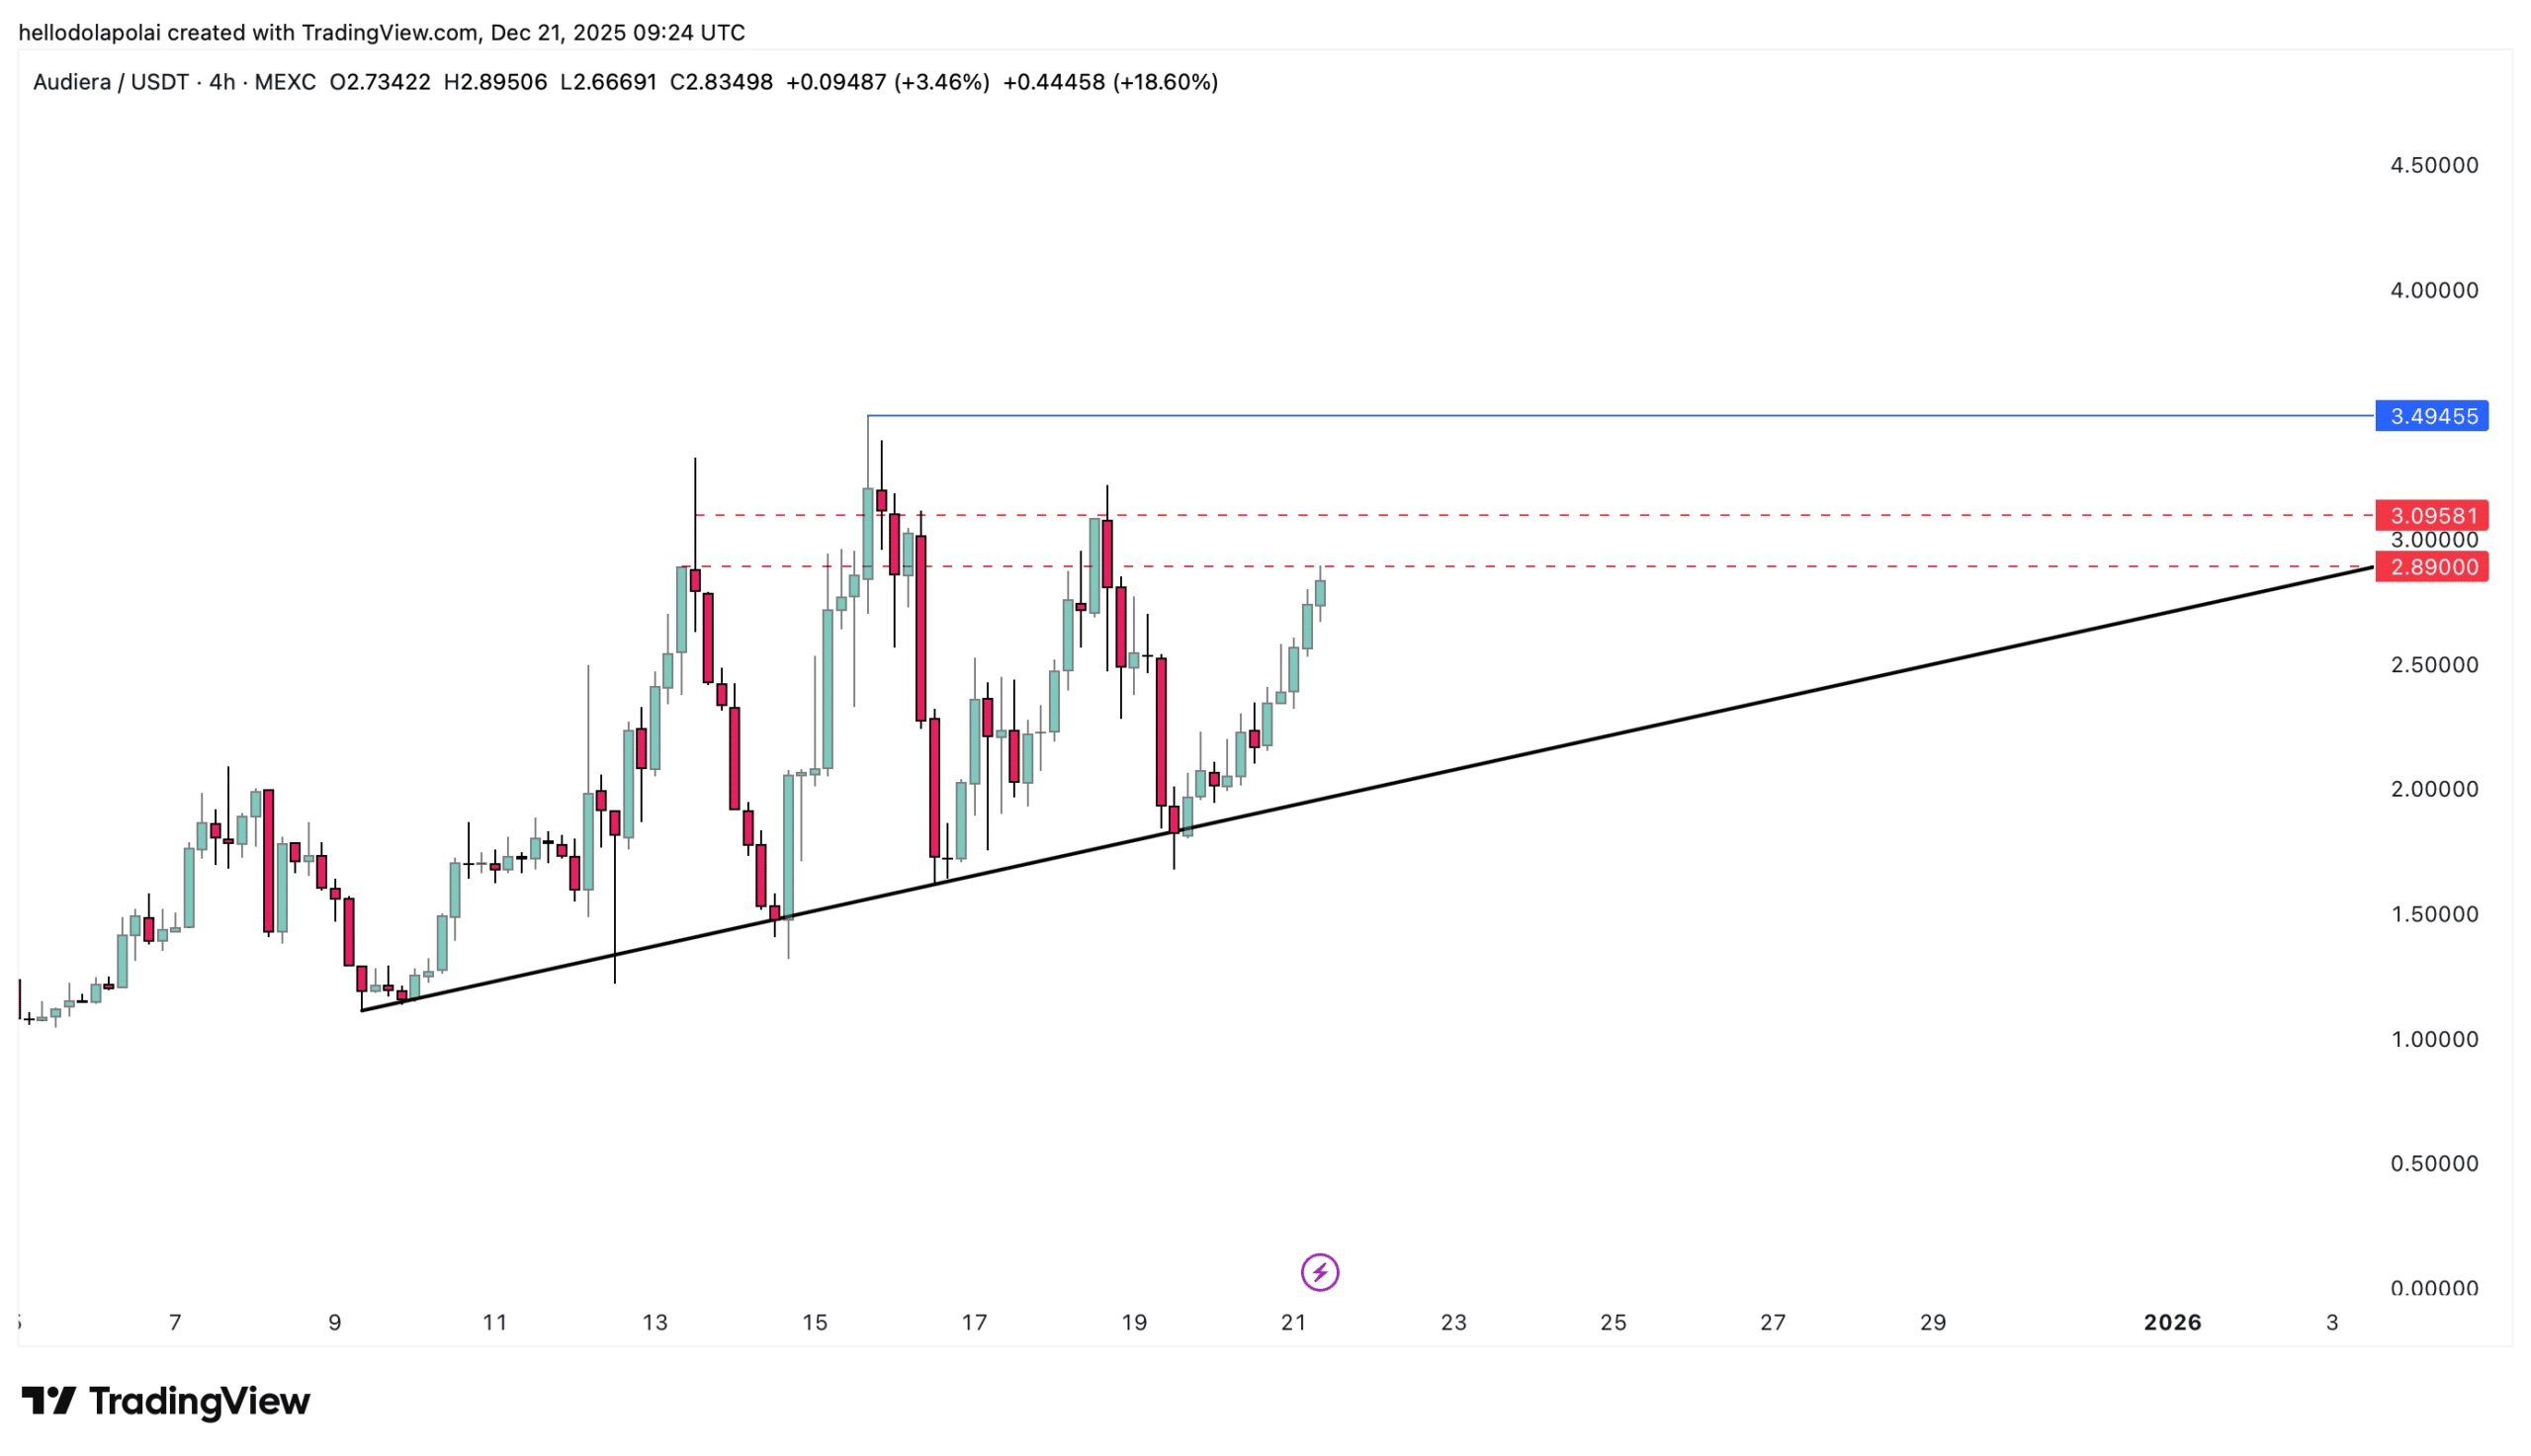
BEAT heats up, rallies 30%! A key level stands before Audiera’s ATH
Trending news
MoreDTCC and JPMorgan just set the on-chain schedule, but the pilot relies on a controversial “undo” button
Bitget Daily Digest (Dec.22)|The U.S. House of Representatives Is Considering a Tax Safe Harbor for Stablecoins and Crypto Staking; Large Token Unlocks for H, XPL, SOON, and Others This Week; BTC RSI Near a 3-Year Low