Date: Sun, Dec 14, 2025 | 08:26 AM GMT
The broader altcoins market has been experiencing choppy price action over the past several weeks. However, Core (CORE) has managed to break away from the general weakness, posting an impressive 28% single-day surge. Beyond the price spike, the daily chart is beginning to reveal a technical structure that suggests a larger bullish move could be building beneath the surface.
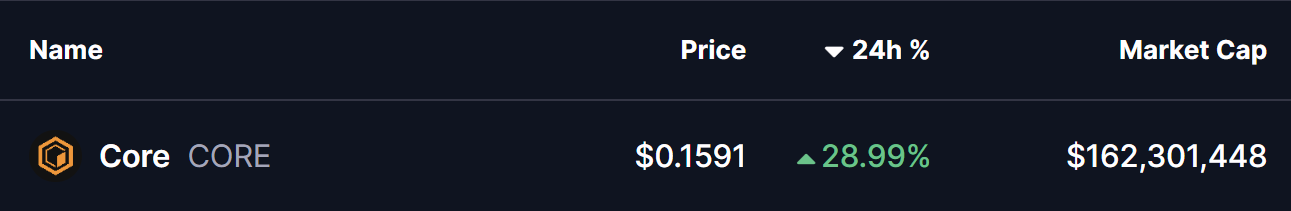 Source: Coinmarketcap
 Falling Wedge Pattern in Play
On the daily timeframe, CORE is shaping a well-defined falling wedge formation, a pattern typically associated with trend exhaustion and bullish reversals. The structure reflects progressively lower highs and lower lows, but with selling pressure gradually weakening as price compresses toward the wedge apex.
Recently, CORE’s decline drove price down to the lower boundary of the wedge near the $0.084 region. This level acted as strong dynamic support, where buyers stepped in aggressively and triggered a sharp rebound. That bounce has now lifted CORE back toward $0.1590, placing it just below the wedge’s upper resistance trendline.
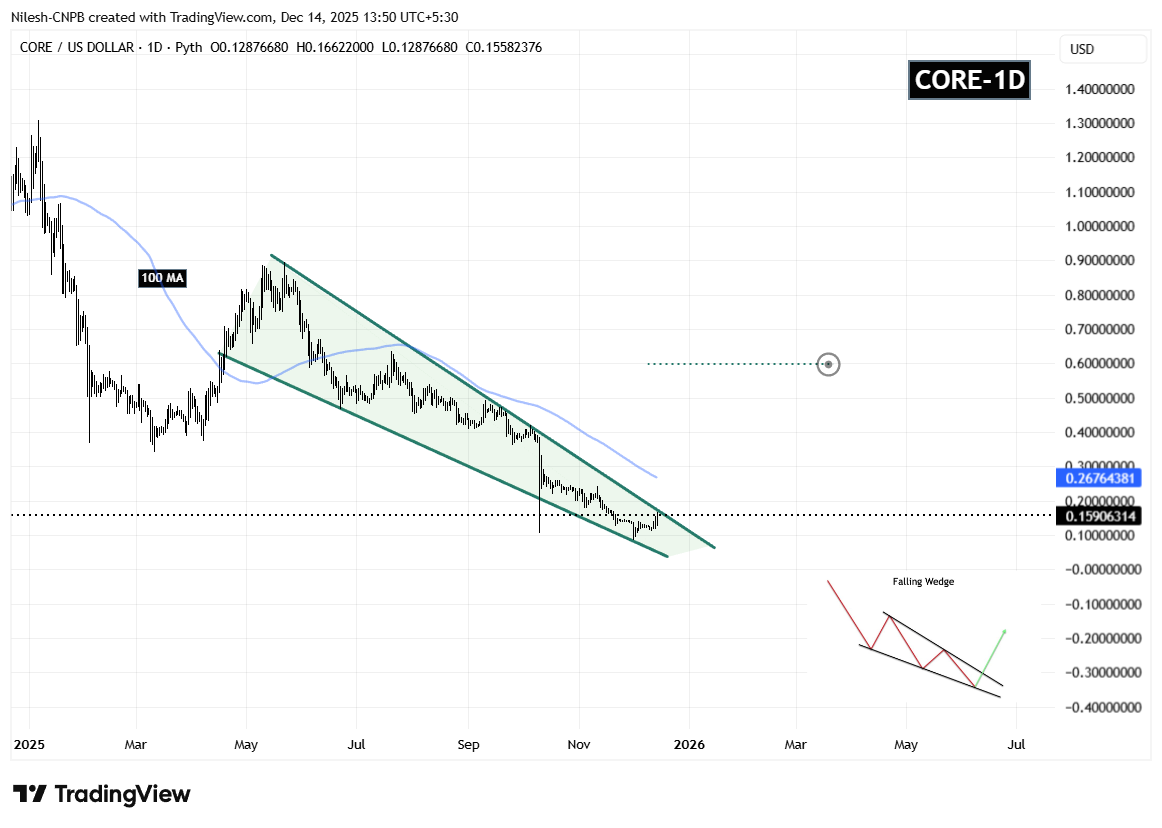 Core (CORE) Daily Chart/Coinsprobe (Source: Tradingview)
 The recovery is also unfolding below the 100-day moving average, currently positioned near $0.2676. This moving average represents a major technical barrier, and a decisive reclaim would signal a meaningful shift in market structure from corrective to bullish.
What’s Next for CORE?
If buyers manage to push CORE above the falling wedge resistance and secure a sustained close above the 100-day moving average at $0.2676, the falling wedge breakout would be confirmed. In that scenario, the chart opens up a bullish continuation path toward the projected target near $0.5985, aligning with the measured move of the pattern and prior liquidity zones.
However, if CORE fails to break through resistance, a short-term pullback remains possible. In that case, the $0.084–$0.10 region becomes critical once again, as bulls must defend this zone to preserve the bullish structure and prevent a deeper retracement.
For now, CORE stands at a technical inflection point. With momentum improving and selling pressure fading, the coming sessions will be crucial in determining whether this falling wedge resolves higher and marks the beginning of a new upside phase.