Bitget App
Giao dịch thông minh hơn

Bitget: Top 4 toàn cầu về khối lượng giao dịch hàng ngày!
Thị phần BTC58.35%
Phí gas ETH hiện tại: 0.1-1 gwei
Năm Bitcoin Halving: 2024, 2028
BTC/USDT$123710.22 (-0.82%)Chỉ số Sợ hãi và Tham lam71(Tham lam)
Chỉ số altcoin season:0(Bitcoin season)
Tổng dòng tiền ròng Bitcoin spot ETF +$985.1M (1 ngày); +$2.56B (7 ngày).Gói quà chào mừng dành cho người dùng mới trị giá 6200 USDT.Nhận ngay
Giao dịch mọi lúc, mọi nơi với ứng dụng Bitget.Tải xuống ngay


Dự báo giá Ispolink (ISP)
Chưa niêm yết
Ispolink có thể có giá trị bao nhiêu trong 2025, 2026, 2030 và xa hơn nữa? Dự đoán giá của Ispolink cho ngày mai, tuần này hoặc tháng này là bao nhiêu? Và lợi nhuận đầu tư bạn có thể nhận được nếu nắm giữ Ispolink đến năm 2050 là bao nhiêu?
Trang này cung cấp cả công cụ dự đoán giá Ispolink trong ngắn hạn và dài hạn để giúp bạn đánh giá hiệu suất giá tương lai của Ispolink. Bạn cũng có thể tự đặt ra các dự báo của bạn để ước tính giá trị tương lai của Ispolink.
Điều quan trọng cần lưu ý rằng: với sự biến động vốn có và mức độ phức tạp của thị trường tiền điện tử, các dự đoán này - mặc dù cung cấp thông tin về những vùng giá tiềm năng cũng như các kịch bản - nhưng vẫn nên được xem xét một cách thận trọng và hoài nghi.
Biểu đồ dự đoán giá Ispolink cho năm 2025 và xa hơn nữa
Dự đoán giá của Ispolink trong 10 ngày tới dựa trên tốc độ tăng trưởng hàng ngày dự kiến là +0.014%.
Giá hôm nay (Oct 6, 2025)
$0.0003116
Giá ngày mai (Oct 7, 2025)
$0.0003116
Giá sau 5 ngày (Oct 11, 2025)
$0.0003118
Giá tháng này (Oct 2025)
$0.0003121
Giá trong tháng sau (Nov 2025)
$0.0003134
Giá sau 5 tháng (Mar 2026)
$0.0003187
Giá trong năm 2025
$0.0003193
Giá trong năm 2026
$0.0003352
Giá trong năm 2030
$0.0004075
Dựa trên dự đoán giá hàng ngày ngắn hạn của Ispolink, giá của Ispolink được dự báo sẽ là $0.0003116 vào Oct 6, 2025, $0.0003116 vào Oct 7, 2025 và $0.0003118 vào Oct 11, 2025. Đối với dự đoán giá hàng tháng của Ispolink, giá của Ispolink dự kiến sẽ là $0.0003121 vào Oct 2025, $0.0003134 vào Nov 2025 và $0.0003187 vào Mar 2026. Đối với các dự đoán giá dài hạn Ispolink hàng năm, giá của Ispolink được dự báo sẽ là $0.0003193 vào 2025, $0.0003352 vào 2026 và $0.0004075 vào 2030.
Dự đoán giá Ispolink cho hôm nay
Giá hiện tại của Ispolink (ISP) là $0.0003123, với mức biến động giá trong 24 giờ là 4.64%. Giá của Ispolink (ISP) được dự báo sẽ đạt $0.0003116 trong hôm nay. Tìm hiểu thêm về Giá Ispolink hôm nay.
Dự đoán giá Ispolink cho Oct 2025
Giá của Ispolink (ISP) được dự báo sẽ thay đổi 17.72% trong Oct 2025 và giá của Ispolink (ISP) được dự báo sẽ đạt $0.0003121 vào cuối Oct 2025.
Dự đoán giá Ispolink cho năm 2025
Giá của Ispolink (ISP) được dự báo sẽ thay đổi -70.44% trong năm 2025 và giá của Ispolink (ISP) sẽ đạt $0.0003193 vào cuối năm 2025.
Dự đoán giá dài hạn của Ispolink: 2026, 2030, 2035, 2040, 2050
Dưới đây là mô hình dự đoán giá Ispolink dựa trên tốc độ tăng trưởng cố định. Mô hình này bỏ qua tác động của biến động thị trường, các yếu tố kinh tế bên ngoài hoặc các tình huống khẩn cấp và thay vào đó chỉ tập trung vào xu hướng giá trung bình của Ispolink. Mô hình này giúp nhà đầu tư phân tích và nhanh chóng tính toán tiềm năng lợi nhuận khi đầu tư vào Ispolink.
Nhập tốc độ tăng trưởng hàng năm dự kiến của bạn cho giá Ispolink và xem giá trị của Ispolink sẽ thay đổi như thế nào trong tương lai.
Nhập tốc độ tăng trưởng hàng năm dự kiến của bạn cho giá Ispolink và xem giá trị của Ispolink sẽ thay đổi như thế nào trong tương lai.
Dự đoán giá Ispolink hàng năm dựa trên tốc độ tăng trưởng hàng năm dự kiến là 5%
%
Tăng trưởng hàng năm dự kiến. Nhập một tỷ lệ phần trăm từ -100% đến +1000%.
| Năm | Giá dự đoán | Tổng ROI |
|---|---|---|
2026 | $0.0003352 | +5.00% |
2027 | $0.0003520 | +10.25% |
2028 | $0.0003696 | +15.76% |
2029 | $0.0003881 | +21.55% |
2030 | $0.0004075 | +27.63% |
2035 | $0.0005200 | +62.89% |
2040 | $0.0006637 | +107.89% |
2050 | $0.001081 | +238.64% |
Dựa trên tốc độ tăng trưởng hàng năm là 5%, giá Ispolink (ISP) được dự báo sẽ đạt $0.0003352 vào năm 2026, $0.0004075 vào năm 2030, $0.0006637 vào năm 2040 và $0.001081 vào năm 2050.
Dự đoán giá Ispolink cho năm 2026
Trong năm 2026, dựa trên tốc độ tăng trưởng hàng năm dự kiến là 5%, giá của Ispolink (ISP) được kỳ vọng sẽ đạt $0.0003352. Dựa trên dự báo này, lợi nhuận tích lũy từ việc nắm giữ Ispolink đến cuối năm 2026 sẽ là 5.00%.
Dự đoán giá Ispolink cho năm 2030
Trong năm 2030, dựa trên tốc độ tăng trưởng hàng năm dự kiến là 5%, giá của Ispolink (ISP) được kỳ vọng sẽ đạt $0.0004075. Dựa trên dự báo này, lợi nhuận tích lũy từ việc nắm giữ Ispolink đến cuối năm 2030 sẽ là 27.63%.
Dự đoán giá Ispolink cho năm 2035
Trong năm 2035, dựa trên tốc độ tăng trưởng hàng năm dự kiến là 5%, giá của Ispolink (ISP) được kỳ vọng sẽ đạt $0.0005200. Dựa trên dự báo này, lợi nhuận tích lũy từ việc nắm giữ Ispolink đến cuối năm 2035 sẽ là 62.89%.
Dự đoán giá Ispolink cho năm 2040
Trong năm 2040, dựa trên tốc độ tăng trưởng hàng năm dự kiến là 5%, giá của Ispolink (ISP) được kỳ vọng sẽ đạt $0.0006637. Dựa trên dự báo này, lợi nhuận tích lũy từ việc nắm giữ Ispolink đến cuối năm 2040 sẽ là 107.89%.
Dự đoán giá Ispolink cho năm 2050
Trong năm 2050, dựa trên tốc độ tăng trưởng hàng năm dự kiến là 5%, giá của Ispolink (ISP) được kỳ vọng sẽ đạt $0.001081. Dựa trên dự báo này, lợi nhuận tích lũy từ việc nắm giữ Ispolink đến cuối năm 2050 sẽ là 238.64%.
Bạn sẽ kiếm được bao nhiêu từ Ispolink?
Nếu bạn đầu tư $100 vào Ispolink trong năm nay và nắm giữ cho đến năm 2026, dự đoán giá cho thấy bạn có thể đạt lợi nhuận tiềm năng là $5, tương ứng với 5.00% ROI. (Phí không được tính trong ước tính này).
Tuyên bố miễn trừ trách nhiệm: Đây không phải là lời khuyên đầu tư. Thông tin được cung cấp chỉ nhằm mục đích tham khảo chung. Không có thông tin, tài liệu, dịch vụ hay bất kỳ nội dung nào được cung cấp trên trang này được coi là lời mời, khuyến nghị, xác nhận hoặc bất kỳ hình thức tư vấn tài chính, đầu tư, hoặc lời khuyên nào khác. Bạn nên tham khảo ý kiến chuyên gia độc lập dưới dạng tư vấn pháp lý, tài chính, hoặc tư vấn thuế trước khi đưa ra bất kỳ quyết định đầu tư nào.
Bảng dự đoán giá Ispolink ngắn hạn
Dự đoán giá Ispolink hàng ngày dựa trên tốc độ tăng trưởng hàng ngày 0.014%
Dự đoán giá Ispolink cho ngày mai, sau 5 ngày, 10 ngày và xa hơn nữa là bao nhiêu?%
Dự đoán tăng trưởng hàng ngày. Nhập một tỷ lệ phần trăm từ –100% đến +1000%.
| Ngày | Giá dự đoán | Tổng ROI |
|---|---|---|
Oct 7, 2025 (Ngày mai) | $0.0003116 | +0.01% |
Oct 8, 2025 | $0.0003116 | +0.03% |
Oct 9, 2025 | $0.0003117 | +0.04% |
Oct 10, 2025 | $0.0003117 | +0.06% |
Oct 11, 2025 (5 ngày sau) | $0.0003118 | +0.07% |
Oct 12, 2025 | $0.0003118 | +0.08% |
Oct 13, 2025 | $0.0003119 | +0.10% |
Oct 14, 2025 | $0.0003119 | +0.11% |
Oct 15, 2025 | $0.0003120 | +0.13% |
Oct 16, 2025 (10 ngày sau) | $0.0003120 | +0.14% |
Dựa trên tốc độ tăng trưởng hàng ngày 0.014%, giá Ispolink (ISP) dự kiến đạt $0.0003116 vào Oct 7, 2025, $0.0003118 vào Oct 11, 2025 và $0.0003120 vào Oct 16, 2025.
Dự đoán giá Ispolink cho năm Oct 7, 2025
Dựa trên tốc độ tăng trưởng hàng ngày 0.014% cho dự đoán giá Ispolink, giá trị ước tính của 1 Ispolink sẽ là $0.0003116 vào ngày Oct 7, 2025 (Ngày mai). ROI dự kiến khi đầu tư và nắm giữ Ispolink cho đến cuối Oct 7, 2025 là 0.01%.
Dự đoán giá Ispolink cho năm Oct 11, 2025
Dựa trên tốc độ tăng trưởng hàng ngày 0.014% cho dự đoán giá Ispolink, giá trị ước tính của 1 Ispolink sẽ là $0.0003118 vào ngày Oct 11, 2025 (5 ngày sau). ROI dự kiến khi đầu tư và nắm giữ Ispolink cho đến cuối Oct 11, 2025 là 0.07%.
Dự đoán giá Ispolink cho năm Oct 16, 2025
Dựa trên tốc độ tăng trưởng hàng ngày 0.014% cho dự đoán giá Ispolink, giá trị ước tính của 1 Ispolink sẽ là $0.0003120 vào ngày Oct 16, 2025 (10 ngày sau). ROI dự kiến khi đầu tư và nắm giữ Ispolink cho đến cuối Oct 16, 2025 là 0.14%.
Dự đoán giá Ispolink hàng tháng dựa trên tốc độ tăng trưởng hàng tháng 0.42%
Dự đoán giá Ispolink cho tháng sau, sau 5 tháng, 10 tháng và xa hơn nữa là bao nhiêu?%
Dự đoán tăng trưởng hàng tháng. Nhập một tỷ lệ phần trăm từ –100% đến +1000%.
| Ngày | Giá dự đoán | Tổng ROI |
|---|---|---|
Nov 2025 (Tháng sau) | $0.0003134 | +0.42% |
Dec 2025 | $0.0003147 | +0.84% |
Jan 2026 | $0.0003160 | +1.27% |
Feb 2026 | $0.0003174 | +1.69% |
Mar 2026 (5 tháng sau) | $0.0003187 | +2.12% |
Apr 2026 | $0.0003200 | +2.55% |
May 2026 | $0.0003214 | +2.98% |
Jun 2026 | $0.0003227 | +3.41% |
Jul 2026 | $0.0003241 | +3.84% |
Aug 2026 (10 tháng sau) | $0.0003254 | +4.28% |
Dựa trên tốc độ tăng trưởng hàng tháng 0.42%, giá Ispolink (ISP) dự kiến đạt $0.0003134 vào Nov 2025, $0.0003187 vào Mar 2026 và $0.0003254 vào Aug 2026.
Dự đoán giá Ispolink cho năm Nov 2025
Dựa trên tốc độ tăng trưởng hàng tháng 0.42%, giá dự đoán của Ispolink (ISP) vào Nov 2025 (Tháng sau) là $0.0003134. ROI dự kiến khi đầu tư và nắm giữ Ispolink cho đến cuối Nov 2025 là 0.42%.
Dự đoán giá Ispolink cho năm Mar 2026
Dựa trên tốc độ tăng trưởng hàng tháng 0.42%, giá dự đoán của Ispolink (ISP) vào Mar 2026 (5 tháng sau) là $0.0003187. ROI dự kiến khi đầu tư và nắm giữ Ispolink cho đến cuối Mar 2026 là 2.12%.
Dự đoán giá Ispolink cho năm Aug 2026
Dựa trên tốc độ tăng trưởng hàng tháng 0.42%, giá dự đoán của Ispolink (ISP) vào Aug 2026 (10 tháng sau) là $0.0003254. ROI dự kiến khi đầu tư và nắm giữ Ispolink cho đến cuối Aug 2026 là 4.28%.
Các bài viết dự đoán giá tiền điện tử đang được quan tâm
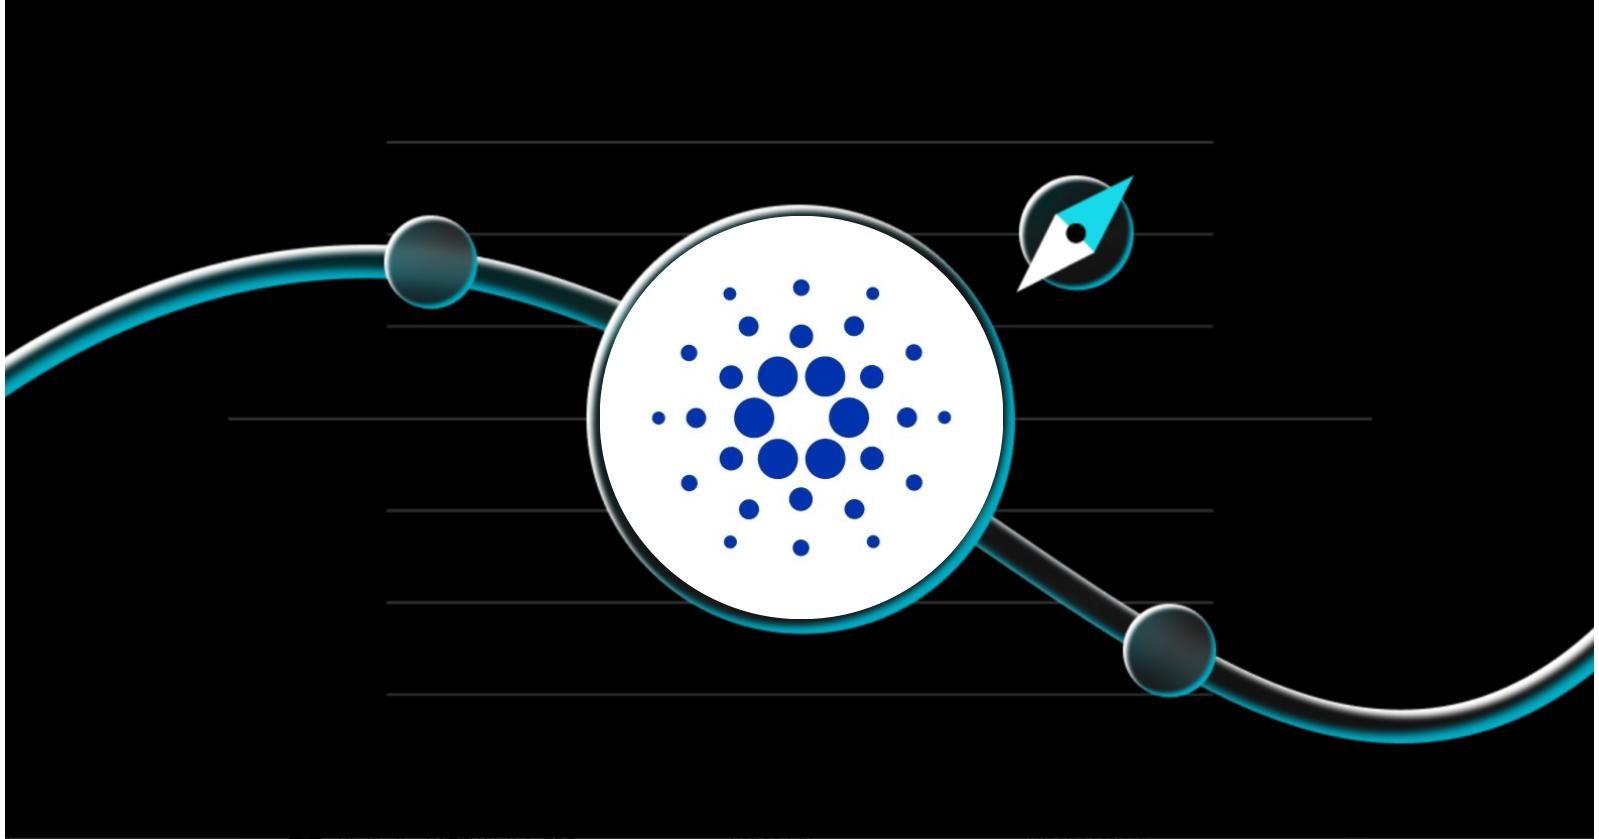
Cardano (ADA) Price Prediction for October 2025: Will ETF Approval Finally Push ADA Above $1?
Crypto traders are welcoming “Uptober” 2025 with growing excitement as markets show renewed strength. Bitcoin has surged beyond $120,000, setting a fresh all-time high on the back of ETF inflows and institutional demand, while Ethereum holds firm near multi-year highs. The upbeat sentiment is spilling over into altcoins — and among them, Cardano (ADA) is capturing renewed interest. Known for its research-based development and consistent community support, Cardano remains a top-10 cryptocurrency and continues to gain legitimacy, recently earning a 1.2% weighting in the Hashdex Nasdaq Crypto Index ETF.
Still, ADA’s price lingers below the $1 mark, well short of its 2021 peak near $3. That gap between progress and price has traders asking: could an ETF approval finally be the spark ADA needs to reclaim $1? With the U.S. SEC preparing decisions on several crypto ETFs this month — including two focused on Cardano — the coming weeks could be pivotal. This article explores ADA’s current market position, the ETF timeline, ongoing on-chain upgrades like Chang, Hydra, and Ouroboros Leios, and what analysts expect from Cardano through this much-anticipated October.
Cardano (ADA) Market Overview: Price Trends and Investor Outlook
Cardano (ADA) Price in October
Source: CoinMarketCap
As of early October 2025, Cardano (ADA) is trading in the $0.83–$0.86 range, showing mild recovery momentum after a quiet few weeks. The token has climbed roughly 67% from its year-to-date low, reflecting growing confidence among long-term holders as the broader crypto market gains strength. However, ADA continues to face familiar headwinds. The $0.95–$1.00 zone remains a stubborn resistance area — both psychologically and technically — where traders often take profits. On the flip side, support levels around $0.75 have proven resilient, partly thanks to whale accumulation and renewed interest from institutional players positioning ahead of potential catalysts.
Investor sentiment toward Cardano is cautiously optimistic heading into October. Many traders see the current consolidation as a buildup before a breakout, especially with the ETF decision looming later this month. The overall crypto market’s positive tone, led by Bitcoin’s record-setting rally, has also helped stabilize ADA’s price action. Still, analysts caution that a convincing move above $1.00 will likely require a strong catalyst — either a favorable regulatory outcome or a surge in trading volume. For now, ADA appears to be coiling between support and resistance, quietly preparing for what could be a decisive month in its 2025 journey.
ETF Approval on the Horizon — Will It Be a Game-Changer?
One of the biggest storylines for Cardano (ADA) this October is the long-awaited ETF decision. After years of speculation, October 2025 could finally bring clarity as the U.S. Securities and Exchange Commission (SEC) prepares to rule on two major proposals:
Grayscale’s application to convert its existing Cardano Trust into a spot ADA ETF (decision expected October 7).
Tuttle Capital’s proposal for a standalone Cardano ETF (decision expected October 26).
These two dates have become focal points for ADA investors, with many viewing this month as potentially decisive for the token’s short-term direction.
If an ETF is approved, the potential impact could be significant:
It would open regulated access for traditional investors, including hedge funds and retirement accounts, to gain ADA exposure without direct crypto custody.
Analysts expect a notable liquidity boost, similar to the inflows seen after the approval of Bitcoin and Ethereum ETFs.
A positive decision could lead to a 20–30% price rally, possibly allowing ADA to finally break above the $1 mark for the first time in years.
However, some market watchers caution that the optimism might already be priced in. A delay or rejection could trigger short-term disappointment and a fallback toward the $0.70–$0.75 range.
Prediction markets currently assign over a 90% chance of at least one ADA ETF being approved this month, reflecting strong bullish sentiment. Still, history suggests that even positive regulatory news can bring volatility. For now, the Cardano community is waiting with cautious optimism.
Cardano’s On-Chain Upgrades and Ecosystem Roadmap
While traders focus on ETF headlines, long-term investors are paying attention to Cardano’s steady technical progress. Over the past year, the network has advanced through major upgrades that strengthen its scalability, governance, and developer ecosystem — reflecting its vision of a sustainable, research-driven blockchain.
Key milestones shaping Cardano’s roadmap include:
Chang Hard Fork (Voltaire Era): Introduces on-chain governance, allowing ADA holders to vote through Delegate Representatives (DReps) and shaping a more community-driven decision model.
Ouroboros Leios: A next-generation consensus protocol designed to greatly increase transaction throughput and network efficiency.
Hydra Scaling Solution: A layer-2 upgrade enabling near-instant, low-fee transactions — ideal for DeFi, gaming, and everyday payments.
Mithril Protocol: Uses stake-based snapshots to speed up node synchronization, improving security and accessibility.
Midnight Sidechain: Cardano’s upcoming privacy-focused sidechain, supporting confidential smart contracts and selective transparency for compliance.
Together, these upgrades aim to enhance governance, scalability, and privacy — the three pillars of Cardano’s long-term roadmap. Even if they don’t move ADA’s price immediately, they strengthen the project’s fundamentals and make Cardano one of the most technologically prepared platforms heading into 2026.
Expert Opinions on Cardano (ADA): Cautious Optimism or Overhype?
As ETF anticipation builds, market analysts are weighing in on Cardano’s (ADA) prospects for October 2025. The community’s focus is clear: will ETF approval finally drive ADA above $1, or is the market getting ahead of itself? Opinions remain divided, with analysts split between cautious realism and renewed optimism.
On the bullish side, market strategists believe that a successful ETF approval could reprice ADA higher and finally push it above the long-standing $1 barrier. Several reports suggest that if institutional capital flows into ADA through ETFs, its valuation could climb 20–30% in the short term, and possibly reach $1.20–$1.30 by the end of October. These predictions assume continued momentum from Bitcoin’s rally and steady progress in Cardano’s ecosystem.
However, more cautious analysts argue that much of this optimism is already reflected in the current price. They note that Cardano’s on-chain activity, while growing, still lags behind networks like Ethereum and Solana. From this perspective, even if an ETF is approved, ADA could see a “buy the rumor, sell the news” effect — rallying briefly before returning to its consolidation range near $0.80–$0.90.
Cardano (ADA) Outlook for October 2025: Bullish, Neutral, or Bearish?
While no one can predict the exact outcome, three likely scenarios capture the range of possibilities investors are watching most closely.
1. Bullish Scenario – ETF Approval and Momentum Builds
If the SEC gives the green light to at least one Cardano ETF, ADA could see a strong breakout above $1, ending its long period of consolidation. Increased institutional access might drive short-term gains of 20–30%, pushing prices toward $1.20–$1.30. In this case, optimism from both retail and institutional investors could help ADA maintain higher levels through the end of the month.
2. Neutral Scenario – Delays or Modest Reaction
If the decision is delayed or approval fails to spark major inflows, ADA may remain rangebound between $0.80 and $0.95. Traders could interpret the lack of immediate excitement as a “wait-and-see” moment, keeping volatility low. The broader market’s tone — especially Bitcoin’s performance — would likely dictate ADA’s short-term direction under this outcome.
3. Bearish Scenario – Rejection or Market Pullback
If the SEC rejects the ETF or delivers another setback to altcoin-focused funds, ADA might retrace toward its support zone around $0.70–$0.75. A rejection would likely trigger short-term selling pressure, especially from speculative positions built on ETF optimism. Even so, many long-term holders are expected to use lower prices as a buying opportunity, confident in Cardano’s continued network growth and upcoming upgrades.
Conclusion
The coming weeks could prove decisive for Cardano (ADA). With the ETF decision on the horizon, investors are watching closely to see whether this long-anticipated event will finally give ADA the momentum to move past $1. It’s a moment charged with possibility — the kind that could either confirm Cardano’s return to market strength or remind everyone how unpredictable the crypto landscape can be.
Yet beyond the speculation, Cardano continues to chart its own deliberate path. Its progress through upgrades like Ouroboros Leios, Hydra, and Midnight shows a project focused not just on price, but on building a resilient foundation for the future. Whether or not the ETF acts as a short-term spark, Cardano’s evolution suggests something deeper: a network preparing for a phase of growth that may unfold when the market least expects it.
Disclaimer: The opinions expressed in this article are for informational purposes only. This article does not constitute an endorsement of any of the products and services discussed or investment, financial, or trading advice. Qualified professionals should be consulted prior to making financial decisions.
Học viện Bitget2025-10-06 07:48

What Is Morpho (MORPHO)? The DeFi Lending Protocol That Could Change Everything
Despite the explosive growth of decentralized finance, many DeFi lending platforms remain inefficient, with lenders often earning subpar yields and borrowers facing high interest rates. In 2025 alone, over $50 billion in crypto loans were issued on major platforms, yet much of this capital remained underutilized due to rigid lending structures and lack of direct borrower-lender matching. This inefficiency highlights a clear need for smarter, more capital-efficient solutions in the DeFi ecosystem.
Morpho (MORPHO) addresses this challenge by introducing a peer-to-peer lending layer that sits atop existing DeFi protocols like Aave and Compound. By directly matching lenders with borrowers whenever possible, Morpho optimizes capital use, reduces borrowing costs, and increases returns for participants. With billions of dollars already locked into its smart contracts and strategic partnerships with platforms like Crypto.com, Morpho is fast emerging as a DeFi protocol capable of transforming crypto lending as we know it.
What Is Morpho Protocol?
Morpho Protocol is a decentralized, non-custodial lending platform built on Ethereum and other EVM-compatible chains. Created by Morpho Labs, Morpho has quickly grown to become one of the largest DeFi lending networks, attracting billions in user deposits. Unlike traditional DeFi lending platforms that rely entirely on large liquidity pools, Morpho introduces a peer-to-peer (P2P) matching layer that directly connects lenders and borrowers whenever possible. This design allows participants to enjoy higher yields and lower borrowing costs while keeping full control of their funds.
At its core, Morpho enables users to create customizable lending markets, choosing specific collateral types, loan assets, and interest rate models. Lenders can deposit their crypto into these markets or into Morpho Vaults, which are managed funds that optimize returns while remaining non-custodial. Meanwhile, borrowers can take overcollateralized loans in a secure and trustless environment. By combining the reliability of established lending pools like Aave and Compound with its own efficiency-enhancing layer, Morpho is redefining the standards for DeFi lending.
How Morpho Protocol Works
Morpho operates as a peer-to-peer lending overlay on top of existing DeFi protocols like Aave and Compound. Instead of simply pooling funds and distributing interest according to the pool’s rates, Morpho matches lenders and borrowers directly whenever possible, creating a more efficient and cost-effective system. This approach not only optimizes capital usage but also provides better yields for lenders and lower borrowing costs for borrowers.
● Peer-to-Peer Matching: Morpho maintains its own internal order books for each asset. Borrowers and lenders are paired directly, allowing lenders to earn slightly higher interest while borrowers pay less than the standard pool rate. Any leftover supply or demand is automatically routed to the underlying lending pool.
● Morpho Vaults: These are non-custodial, permissionless vaults where users can deposit assets and earn optimized yields. Vaults are managed by risk curators who allocate funds across multiple lending markets while preserving users’ control over their assets.
● DAO Governance: MORPHO token holders participate in the protocol’s decision-making process, voting on upgrades, interest rate models, market parameters, and other protocol changes. This ensures that the platform evolves in alignment with the community’s interests.
● Bundlers for Efficiency: Morpho allows multiple actions—such as lending, borrowing, or staking—to be executed in a single transaction. This reduces gas costs and simplifies user interactions on the platform.
Morpho creates a highly efficient and user-friendly DeFi lending experience. Lenders benefit from higher yields, borrowers enjoy lower interest rates, and the protocol maintains security and decentralization by leveraging well-audited smart contracts.
Morpho (MORPHO) Tokenomics
Morpho (MORPHO) Token Allocation
The MORPHO token is the native utility and governance token of the Morpho Protocol. With a maximum supply of 1 billion tokens, MORPHO is primarily used for governance, allowing holders to vote on protocol upgrades, interest rate models, and market parameters.
Beyond governance, MORPHO serves as a tool to incentivize network activity, encouraging lenders and borrowers to participate actively in the protocol. By integrating these incentives with a balanced distribution, Morpho aims to create a sustainable and engaged ecosystem where users have a direct stake in the protocol’s growth and success.
Morpho Teams Up with Crypto.com for Cronos Lending
In a major development for DeFi adoption, Morpho has partnered with Crypto.com and the Cronos blockchain to bring its lending and borrowing infrastructure to a broader audience. This collaboration enables Crypto.com users to access stablecoin yields and crypto lending markets powered by Morpho, allowing them to deposit assets like BTC and ETH on Cronos and earn optimized returns without leaving the platform.
The integration leverages Morpho’s peer-to-peer matching system and vault architecture, ensuring efficient capital usage and higher yields for lenders while keeping borrowing costs competitive. By embedding Morpho’s technology, Crypto.com can offer its users double-digit stablecoin yields and seamless access to DeFi markets, combining the security and user-friendliness of a centralized platform with the efficiency of decentralized finance. This partnership highlights Morpho’s growing influence in the DeFi ecosystem and its potential to bring DeFi lending to mainstream crypto users.
Morpho (MORPHO) Price Prediction for 2025, 2026–2030
Morpho (MORPHO) Price Today
Source: CoinMarketCap
As of October 3, 2025, Morpho (MORPHO) is trading at around $1.96, showing a 6.5% increase in the last 24 hours. This recent surge reflects growing investor interest, fueled by partnerships and increasing adoption across the DeFi ecosystem.
Price predictions by year range:
● 2025: MORPHO could reach around $3.00 if adoption rises and Total Value Locked (TVL) grows due to integrations with platforms like Crypto.com.
● 2026: Analysts predict further growth, with MORPHO potentially trading between $2.8–$4.0, supported by expanding user adoption and broader DeFi integration.
● 2027–2030: Long-term forecasts are bullish, with MORPHO possibly reaching $5–$8 by 2030, assuming the protocol continues growing its lending network, user base, and partnerships.
Factors influencing price:
● Growth in TVL: Higher assets locked in Morpho’s markets increase token demand.
● Platform Integrations: Strategic partnerships drive wider usage.
● User Adoption: More active lenders and borrowers strengthen network effects.
● Risks: Market volatility, regulatory changes, and competition from other DeFi platforms could impact performance.
Conclusion
Morpho (MORPHO) is redefining DeFi lending by bridging the gap between traditional liquidity pools and peer-to-peer efficiency. Its use of vaults, direct lender-borrower matching, and DAO governance makes the system simple and rewarding for users. This combination creates new opportunities for lenders and borrowers alike.
With strategic partnerships, billions in total value locked, and growing adoption, Morpho has the potential to become a major player in decentralized finance. The bigger question is, can it maintain this momentum and truly transform crypto lending as we know it? For investors and DeFi enthusiasts, following Morpho’s journey could reveal not just a promising token, but a glimpse into the future of DeFi.
Disclaimer: The opinions expressed in this article are for informational purposes only. This article does not constitute an endorsement of any of the products and services discussed or investment, financial, or trading advice. Qualified professionals should be consulted prior to making financial decisions.
Học viện Bitget2025-10-03 16:20

PancakeSwap (CAKE) Price Prediction: Can It Break $5 Soon?
PancakeSwap’s native token, CAKE, is back in the spotlight after a sharp rally this week. The token is currently trading around $3.30, up nearly 28% in the past 24 hours, marking its strongest performance of 2025 so far. The surge comes on the back of record-breaking trading volumes on PancakeSwap, which hit more than $770 billion in Q3 2025, alongside broader momentum in the DeFi market.
This sudden burst of activity has investors asking the big question: can CAKE finally break the $5 mark? To answer that, we’ll take a closer look at what’s fueling today’s gains, how PancakeSwap’s fundamentals are evolving, and what different scenarios could mean for CAKE price outlook through 2025 and even out to 2030.
Why PancakeSwap (CAKE) Price Is Rising Today
PancakeSwap (CAKE) Price today
Source: CoinMarketCap
CAKE price surge isn’t just random market noise — it’s tied directly to PancakeSwap’s explosive growth in recent months. The decentralized exchange recorded a record $772 billion in trading volume during Q3 2025 , up more than 40% from the previous quarter. Since a portion of every trade goes toward buying back and burning CAKE, higher volume directly translates into more tokens being removed from circulation — a key driver behind today’s rally.
Another catalyst comes from Tokenomics 3.0 , PancakeSwap’s latest upgrade designed to make CAKE deflationary. With reduced emissions and an aggressive burn schedule, the supply of CAKE is shrinking faster than ever. In fact, PancakeSwap has maintained two straight years of monthly net token burns, including over 2.7 million CAKE burned in August 2025 alone.
BNB Price
Source: CoinMarketCap
Lastly, the broader market backdrop is supportive. BNB — the backbone of PancakeSwap’s ecosystem — recently hit a new all-time high, and liquidity flowing into the BNB Chain often spills over into PancakeSwap. Together, these factors explain why CAKE has broken out of its previous range and is now testing higher resistance levels.
PancakeSwap Fundamentals and Growth Drivers
While short-term rallies grab attention, CAKE’s long-term outlook depends on how well PancakeSwap continues to innovate and capture market share in decentralized finance (DeFi). Several core fundamentals are shaping its trajectory:
1. Tokenomics 3.0 and Supply Reductions
PancakeSwap is implementing a deflationary token model where emissions are cut and more fees are directed toward burning CAKE. Over time, this means the circulating supply will shrink, potentially tightening market conditions and supporting higher prices. With around 20% of the total supply targeted for removal by 2030, this is one of the strongest long-term bullish signals for CAKE.
2. Multi-Chain Expansion
PancakeSwap is no longer just a BNB Chain DEX. In 2025, it expanded to networks like Base and Solana, and also rolled out cross-chain swap features. This move diversifies liquidity sources, attracts new users, and ensures the platform is not dependent on one blockchain ecosystem.
3. Trading Volume Growth
The protocol is breaking records. Monthly trading volumes have crossed the hundreds of billions mark, with Q3 2025 setting a new all-time high. High usage doesn’t just highlight adoption — it also means more fees and more CAKE burned, which strengthens the token’s fundamentals.
4. DeFi Market Trends
As decentralized trading, yield farming, and cross-chain swaps become more mainstream, PancakeSwap is well-positioned as one of the most widely used DEX platforms. If DeFi continues its growth trajectory, CAKE could see long-term demand growth aligned with sector expansion.
Together, these factors form the backbone of CAKE’s value proposition, setting the stage for its potential to test — and sustain — higher price levels in the years ahead.
PancakeSwap (CAKE) Price Prediction for 2025
CAKE’s short-term outlook in 2025 hinges on trading volume momentum, the pace of token burns, and overall market sentiment. Based on these factors, here are three possible scenarios:
Bullish Scenario
If PancakeSwap maintains record trading volumes and continues aggressive token burns under Tokenomics 3.0, CAKE could keep climbing through the year. Strong DeFi adoption, coupled with spillover liquidity from BNB’s ecosystem, may help CAKE push past resistance levels. In this case, CAKE could realistically test the $4.50–$5.00 range by late 2025, breaking into new territory if broader crypto markets remain bullish.
Neutral Scenario
In a steadier growth environment, CAKE might consolidate its gains without a big breakout. Consistent burns and multi-chain expansion would still support a gradual upward trend, but without major hype cycles, CAKE may trade in the $3.50–$4.00 range through the end of 2025. This reflects healthy fundamentals but restrained market enthusiasm.
Bearish Scenario
If market sentiment cools or regulatory challenges intensify — such as further access bans like Turkey’s — CAKE could lose momentum. A slowdown in trading volume or heavy sell pressure from unlocks may drive the price back toward the $2.50–$3.00 zone. This would mark a retracement but still keep CAKE above its early-2025 lows.
PancakeSwap (CAKE) Price Outlook: 2026 to 2030
Looking beyond 2025, CAKE’s price path will depend on how effectively PancakeSwap sustains its growth, manages supply reduction, and adapts to evolving DeFi trends. Here are three potential scenarios:
Bullish Long-Term Scenario
If PancakeSwap cements its position as a leading multi-chain DEX, with sustained volume growth and consistent token burns, CAKE could move into higher single digits by the end of the decade. With Tokenomics 3.0 targeting a 20% supply cut by 2030, scarcity could push CAKE into the $8–$10+ range by 2030, especially if DeFi adoption accelerates.
Neutral Long-Term Scenario
Under steady but less explosive growth, PancakeSwap continues to attract users across chains, and burns gradually tighten supply. In this case, CAKE may trade in the $5–$8 range by 2030. This reflects sustainable, incremental adoption without another major DeFi boom cycle.
Bearish Long-Term Scenario
If competition intensifies or regulatory crackdowns weigh heavily on DeFi, PancakeSwap could face slower adoption. Even with token burns, limited demand might keep CAKE’s price capped under $5 well into 2030. In this scenario, CAKE remains a functional governance and utility token but struggles to generate breakout growth.
Conclusion
PancakeSwap’s growth story in 2025 shows how strong fundamentals — from record-breaking trading volumes to deflationary tokenomics — can quickly shift investor sentiment in favor of CAKE. With more supply being burned each month and the platform expanding across multiple chains, the ingredients for long-term value creation are clearly in place. Breaking above $5 now feels closer than it has in years.
Yet the crypto market is rarely predictable. Regulatory hurdles, market cycles, or even shifting user preferences could change the pace of PancakeSwap’s rise. The real question is not just whether CAKE can cross $5 — but whether it can go far beyond it, and how long it might take before the market finds out.
Disclaimer: The opinions expressed in this article are for informational purposes only. This article does not constitute an endorsement of any of the products and services discussed or investment, financial, or trading advice. Qualified professionals should be consulted prior to making financial decisions.
Học viện Bitget2025-10-03 12:58

HUMA Airdrop Part 2 Begun: Claim 10% APR for Staking – Your Guide to Huma Crypto’s Incentives
The HUMA airdrop part 2 has officially begun, offering early participants a fresh opportunity to not only claim free HUMA tokens, but also earn an attractive 10.5% annual percentage rate (APR) through staking. As the Huma crypto project rapidly grows in profile and volume, the ongoing HUMA airdrop is drawing major attention for its innovative real-yield model and robust user rewards. Whether you’re a newcomer to Huma crypto or a seasoned DeFi investor, this comprehensive guide unpacks everything you need to know—eligibility, tokenomics, airdrop claims, the new Feather rewards, and HUMA price outlook—so you can maximize your participation in the HUMA airdrop and the expanding huma crypto ecosystem.
Source: CoinMarketCap
What Is Huma Crypto and How Does It Work?
Founded in 2023, Huma Finance has rapidly established itself as a pioneering force in the human crypto ecosystem by reinventing cross-border payments and liquidity solutions. By leveraging stablecoins and smart contracts, Huma crypto enables real-time, on-chain trade finance, credit settlements, and global remittances, providing seamless access and transparency to global payments. This sets Huma crypto apart from traditional DeFi models that rely heavily on speculative liquidity, as Huma’s yields are rooted in real-world trade activities, particularly serving SMEs and payment service providers.
Notably, the Huma crypto protocol has processed a cumulative transaction volume exceeding $4.3 billion, with total platform revenue surpassing $4.09 million and active liquidity assets above $104 million. The user base, nearing 49,000 depositors, represents an extraordinary ninefold month-over-month growth in the huma crypto arena. Huma crypto now accounts for more than 40% of Solana DeFi TVL, ranking ahead of established protocols such as Jupiter and Raydium.
HUMA Tokenomics
The HUMA token is at the heart of the huma crypto incentive model. Its structure and utility are designed to secure protocol longevity, reward real contribution, and deter short-term speculative behavior:
Total Supply: 10 billion HUMA
Initial Circulation: 17.33%
Distribution Breakdown:
5% allocated for early user airdrops—including the current HUMA airdrop
31% for ecosystem incentives
20.6% assigned to early investors
19.3% for the core team and advisors
1% reserved for presale (subject to a 3-month lock-up)
Key Huma crypto features with HUMA token:
Staking and Yield: Holders can stake HUMA and receive up to 14% APR from protocol revenues
Governance: Voting power in protocol evolution for all HUMA holders
Buyback & Burn: Deflationary supply via profit-powered token repurchase and burning mechanisms
Huma’s April 2024 profit reached $900,000—a testament to the robustness of its model. The recently completed presale valued Huma crypto’s FDV at $75 million, a deep discount designed to capture broad retail and community interest.
HUMA Price and Huma Crypto Network Performance
Since the launch of the HUMA token, huma crypto has witnessed strong market traction:
Current price: $0.03192, as per CoinMarketCap
Market Cap: $71.6 million
Circulating supply: ~2.24 billion
High platform metrics: $4.3 billion+ processed, $4.09 million+ protocol revenue, and $104 million+ active liquidity
These statistics confirm Huma crypto’s role as a dominant force not only in Solana DeFi but also across the broader decentralized finance landscape.
Season 1 HUMA Airdrop (Part 2) Details and the Huma Feather Program
Source: X
The ongoing HUMA airdrop represents a cornerstone of Huma crypto’s commitment to community-driven distribution. Here’s how it works:
Season 1 HUMA Airdrop Structure
Total Allocation: 2.1% of the total HUMA supply (approx. 210 million tokens)
Parts:
Part 1 Claim: Opened August 26, 2024, 13:00 UTC
Part 2 Claim: Live since September 26, 2024, 13:00 UTC
Deadline: All HUMA airdrop claims must be completed by October 26, 2024, 13:00 UTC
Eligibility:
Early Huma crypto depositors and liquidity providers
Users who performed qualifying transactions on supporting blockchains
Recipients identified on-chain as per Huma crypto snapshot and airdrop criteria
Claim Process:
Visit the official claim dashboard
Connect your wallet and verify your airdrop eligibility
Follow the guided steps to receive your HUMA airdrop
Tip: Lock your tokens until after the claim window to maximize any bonus allocation
Network: Distributed primarily on Ethereum (ERC-20); compatible wallets are required
The HUMA airdrop is designed for fair and long-term engagement, meaning those who support and hold through the claim window are best positioned for future opportunities.
Introducing Huma Feather: The Next Phase in Huma Crypto Incentives
Looking forward, Huma crypto is expanding community rewards through the innovative Huma Feather system—essential for Season 2 and future HUMA airdrop events.
What Is Huma Feather?
Huma Feather is a native, on-chain points system that rewards Huma crypto users for meaningful participation. Feathers are earned through:
Providing or staking liquidity on Huma crypto’s supported markets
Engaging in governance, protocol campaigns, or community activities
Referring users and contributing to the ecosystem
How It Works
Non-Transferable: Feathers cannot be traded or transferred; they strictly track user contribution
Progress Tracking: Monitor your balance on the Huma crypto dashboard with your connected wallet
No Direct Monetary Value: Feathers do not act as tokens but directly impact eligibility and allocation size in upcoming airdrops
Feathers and the Future HUMA Airdrop
Feathers are now the qualification metric for Season 2 and subsequent HUMA airdrop campaigns. The more Feathers accumulated, the greater the HUMA allocation a user can expect—making sustained engagement with Huma crypto critically valuable.
HUMA Price Prediction & Outlook
Based on current tokenomics, robust platform fundamentals, and accelerating adoption:
Short-term: The confluence of new airdrop rounds, protocol profitability, and increasing DeFi attention is likely to support renewed trading activity, though investors should anticipate market volatility around large unlock events.
Mid/Long-term: Huma’s unique positioning as a “real-yield” DeFi protocol, deep integrations with Solana, and focus on trade financing, suggest strong potential for price appreciation, contingent on sustained user growth and continued profit scaling.
Considerations: As always, potential investors should conduct their own due diligence and be mindful of market and protocol risks in a fast-evolving sector.
Conclusion
Huma Finance stands out as a leader in blockchain-based financial infrastructure, driving real-world utility and sustainable growth through its PayFi model. The current airdrop not only rewards early adopters but also marks a pivotal moment for expanding community participation. Backed by transparent tokenomics, rapid ecosystem expansion, and a commitment to on-chain yield, Huma Finance remains a noteworthy project for investors and DeFi enthusiasts navigating the future of crypto-powered global payments.
Follow Bitget on X and Win 1 BTC
Disclaimer: The opinions expressed in this article are for informational purposes only. This article does not constitute an endorsement of any of the products and services discussed or investment, financial, or trading advice. Qualified professionals should be consulted prior to making financial decisions.
Học viện Bitget2025-09-28 08:05

Plasma (XPL) Price Prediction for 2025, 2026–2030
In the first hour after its mainnet launch in September 2025, Plasma (XPL) drew in roughly $250 million worth of stablecoins, one of the fastest liquidity inflows ever recorded for a new blockchain. The feature that caught attention was its ability to process USDT transfers without gas fees, a simple proposition that carried wide appeal. At the same time, its native token, XPL, began trading on major exchanges and more than doubled in value during the early sessions, marking one of the more striking openings of the year.
This strong beginning has left investors weighing how far the project can go and what risks may shape its path. In this article, we examine price predictions for Plasma from 2025 through 2030, considering bullish, base, and bearish scenarios for each year. Whether XPL can build on its rapid start—or fade once the early excitement cools—is the question that will define its story over the rest of the decade.
Plasma’s Launch Day: From Record Stablecoin Inflows to Exchange Listings
Plasma (XPL) Price
Source: CoinMarketCap
Plasma’s mainnet went live on September 25, 2025, and quickly distinguished itself with a striking debut. In the first hour, the network drew in about a quarter of a billion dollars in stablecoin deposits, most of it in USDT. By the end of the day, inflows were approaching two billion, a level rarely seen in such a short window for a new blockchain. A promotional airdrop that released 10% of the token supply helped fuel this momentum, encouraging immediate use of the platform.
The appeal rested on a simple but powerful promise: USDT transfers could be made without gas fees. This feature set Plasma apart from established chains, while more complex interactions, such as contract execution, continued to require its native token, XPL. The token’s arrival on major exchanges—Binance, OKX, and KuCoin among them—gave traders easy access from the outset. At launch, XPL had a total supply of ten billion, with about 1.8 billion circulating and another 2.5 billion scheduled for release after a one-year cliff in mid-2026. Together, these elements created both immediate market activity and long-term points of speculation.
2025 Price Prediction
The remainder of 2025 will be shaped by the momentum of Plasma’s launch and the market’s ability to absorb that energy. Early forecasts suggest that XPL could finish the year in a band just above its opening range. One analysis projects values between $1.64 and $1.74, with an average near $1.68. Another sets a wider corridor of $0.90 to $1.50, reflecting the possibility of profit-taking after the initial rush.
Bullish case: If Plasma maintains steady inflows of stablecoins and developers continue building applications on the network, XPL could hold near the higher end of these estimates, trading above $1.50.
Base case: More moderate growth would likely keep the token closer to the $1.20–$1.40 range, where it has already shown signs of stabilizing after the launch surge.
Bearish case: Should early enthusiasm fade or the broader market weaken, XPL could slip below the dollar mark, testing the lower forecasts around $0.90.
In all cases, volatility will remain high. Plasma has a working product and visible traction, but it is still in the first months of its life cycle. Prices are therefore likely to respond quickly to changes in sentiment, exchange activity, and the early data on network usage.
2026 Price Prediction
The year 2026 introduces a structural challenge for XPL: a major token unlock scheduled for mid-year. Roughly 2.5 billion tokens, equal to a quarter of the total supply, are set to come onto the market after a one-year cliff. This event alone could weigh on prices, even if Plasma continues to attract users.
Bullish case: If adoption grows fast enough to offset the supply increase—through higher stablecoin volumes, broader exchange support, and more applications—XPL could trade in the $2.10 to $2.30 range, as some forecasts suggest.
Base case: A more cautious outlook places the token between $1.00 and $1.50, with the unlock creating intermittent sell-side pressure that slows any upward movement.
Bearish case: If demand fails to match the added supply, or if the broader market faces a downturn, XPL could drift back toward $0.75 to $1.00, giving up much of its early premium.
By this stage, the novelty of Plasma’s launch will have passed, and long-term adoption patterns will matter more than promotional campaigns. The mid-2026 unlock will serve as the first real test of whether the project’s fundamentals can support its valuation.
2027 Price Prediction
By 2027, Plasma will either have proven itself as a lasting platform for stablecoin transfers or settled into a smaller niche. The heavy supply event of 2026 will be behind it, and the market will look more closely at adoption figures and developer activity. Forecasts for this year generally show a range that moves XPL further into the low single digits.
Bullish case: If Plasma continues to capture stablecoin flows and builds out a larger ecosystem, XPL could reach $2.70 to $3.20, with some technical models projecting even higher levels near $4.00 to $4.50.
Base case: A steadier outcome would keep the token in the $2.00 to $2.50 range, reflecting incremental growth but not a dramatic shift.
Bearish case: If adoption plateaus or competitors overtake Plasma’s advantages, XPL might stay closer to $1.50 to $2.00, showing little progress beyond its early years.
By this point, the novelty of the launch will no longer matter. What will count is whether Plasma has found a durable place among Layer-1 chains, especially in handling stablecoin traffic.
2028 Price Prediction
By 2028, Plasma will have had several years to prove whether its gas-free transfers are more than a launch attraction. The forecasts for this year show a wider spread, reflecting the uncertainty about how much of the stablecoin market Plasma can realistically capture.
Bullish case: Strong adoption and a robust developer community could push XPL into the $3.50 to $4.50 range, with some optimistic models extending to around $5.50 if growth exceeds expectations.
Base case: If the network continues to expand at a moderate pace, the token may trade between $3.00 and $4.00, consolidating its position without breaking out dramatically.
Bearish case: A slowdown in activity, or pressure from rival chains with similar features, could keep XPL nearer $2.50 to $3.00, suggesting limited progress from earlier years.
By this stage, Plasma’s future will depend less on early incentives and more on whether it has become a trusted settlement layer for stablecoins. Without that role, price growth is likely to remain subdued.
2029 Price Prediction
As 2029 approaches, the market will likely treat Plasma less as a new experiment and more as an established part of the ecosystem—if it maintains relevance. By now, the question will be whether XPL can continue moving deeper into the single-digit price range or whether its growth has already peaked.
Bullish case: With broad adoption and strong network effects, XPL could trade in the $4.50 to $6.00 range, possibly testing higher levels if usage of gas-free stablecoin transfers remains a unique draw.
Base case: More conservative projections keep the token near $4.00 to $5.00, reflecting steady but unspectacular progress.
Bearish case: If Plasma is overshadowed by newer entrants or regulatory pressure limits stablecoin activity, XPL could slip back toward $3.00 to $4.00, erasing some of its gains.
By this point, the market will measure Plasma less on novelty and more on durability. Its value will hinge on consistent transaction volumes and its ability to hold ground against competitors in a crowded field.
2030 Price Prediction
By 2030, Plasma will have been active for five full years, long enough for its role in the market to be clear. Forecasts for this year generally place XPL in the mid-to-high single digits, though the exact figures vary depending on assumptions about adoption and supply management.
Bullish case: If Plasma becomes a major settlement layer for stablecoins and maintains consistent developer interest, XPL could climb to $6.00 to $8.00, with some optimistic projections pointing slightly higher.
Base case: A more measured outcome would see the token in the $5.00 to $6.50 range, consistent with steady adoption but not explosive growth.
Bearish case: Should demand weaken or competing chains dominate the stablecoin market, XPL might remain closer to $4.50 to $5.50, marking a slowdown in momentum.
By the end of the decade, the critical measure will be whether Plasma has achieved lasting relevance. Without that, even modest growth may prove difficult, while success in capturing stablecoin flows could leave XPL firmly valued in the single-digit range.
Can XPL Hit $10?
The idea of XPL reaching $10 has been a recurring question since its launch. On paper, the number is possible, but most forecasts for the next five years stop well short of that mark. The majority of models place XPL in the $5 to $8 range by 2030, even under favorable assumptions about adoption and liquidity. Crossing into double digits would therefore require performance far above the base case.
Several conditions would have to align. Plasma would need to capture a large share of global stablecoin transfers, sustain heavy transaction volumes, and possibly introduce additional features that drive long-term demand for XPL. It would also need to manage its token supply effectively, as scheduled unlocks and inflation can dilute price gains if demand is not strong enough. Even then, broader market conditions, such as regulation of stablecoins or the rise of rival blockchains, would play a decisive role.
A $10 valuation is not out of the question, but it represents an optimistic scenario rather than a central forecast. For most investors, it is better framed as a possibility on the far end of the bullish spectrum rather than an expectation.
Conclusion
Plasma’s launch in late 2025 gave it one of the fastest starts of any recent blockchain, with record stablecoin inflows and immediate trading activity for its token. That early burst has made XPL a subject of attention, but it has also set a high bar for what comes next. Forecasts through 2030 generally place the token in the mid to high single digits, reflecting both optimism about adoption and caution about supply pressures.
The path ahead will depend on how well Plasma holds its initial advantages. Gas-free USDT transfers give it a practical niche, but lasting value will come only if that feature translates into long-term use and consistent transaction volume. The scheduled token unlocks, competition from other chains, and the broader state of the crypto market all stand as important variables. Investors looking at XPL should treat predictions as scenarios rather than certainties, and follow the data on usage and supply closely. By the end of the decade, Plasma may have secured a durable place in the ecosystem, but whether it becomes part of everyday transactions or fades into the long list of experiments is the question that will keep the market curious.
Disclaimer: The opinions expressed in this article are for informational purposes only. This article does not constitute an endorsement of any of the products and services discussed or investment, financial, or trading advice. Qualified professionals should be consulted prior to making financial decisions.
Học viện Bitget2025-09-26 14:07

OpenSea Airdrop and Listing Date Set for October 2025: Everything You Need to Know
After years of powering the largest NFT marketplace in the world, OpenSea is finally setting sail with a token of its own. In October 2025, the platform will launch the SEA token, complete with a community airdrop and a confirmed token generation event (TGE).
The move comes at a time when NFT markets are maturing and competition among platforms is heating up. By introducing SEA, OpenSea is not only rewarding its loyal users but also laying the groundwork for a broader token economy with governance and incentives built in. For investors, this raises an important question: can SEA strengthen OpenSea’s position in Web3 and deliver lasting value once it hits the market?
What Is OpenSea?
OpenSea is the most established and widely used marketplace for non-fungible tokens (NFTs). It was founded in 2017 by Devin Finzer and Alex Atallah, two entrepreneurs who saw the potential of blockchain for creating and trading unique digital assets. Since then, it has grown into the largest NFT marketplace, handling billions of dollars in trading volume and hosting some of the most recognized collections in the space.
From profile-picture projects like Bored Ape Yacht Club to in-game items, art, and music, OpenSea has supported millions of transactions across diverse categories. The platform began with Ethereum but has expanded to other networks such as Polygon, Arbitrum, Solana, and Base. This multi-chain approach allows traders to access a wide range of assets without being limited to a single blockchain’s costs or speed.
At its core, OpenSea serves as a bridge between creators and collectors. Artists can mint and list their work with little technical knowledge, while buyers can connect a crypto wallet and participate in fixed-price sales or auctions. Over the years, OpenSea has become known for liquidity, visibility, and being the first stop for many new NFT projects.
How OpenSea Works
OpenSea functions like an online marketplace, but instead of physical goods, it facilitates the trading of digital assets recorded on blockchains. Everything runs through smart contracts, so buyers and sellers transact directly without needing an intermediary to hold funds or items.
Key aspects of how OpenSea works include:
● Wallet Connection: Users start by linking a crypto wallet such as MetaMask, Coinbase Wallet, or Phantom. The wallet serves as both identity and storage for NFTs and tokens.
● Minting and Listing: Creators can “mint” digital items into NFTs directly on the platform and set them for sale at a fixed price or through auctions.
● Browsing and Trading: Collectors browse listings across multiple blockchains, compare prices, and buy or bid. Once a deal is made, the NFT is transferred automatically to the buyer’s wallet.
● Fees and Revenue: OpenSea typically takes a small percentage fee from each transaction. With the OS2 upgrade, fees were adjusted to 1% on NFT trades and 0.85% on token trades, alongside other reward mechanisms.
● Cross-Chain Support: Beyond Ethereum, OpenSea integrates with Polygon, Arbitrum, Solana, and more, giving users flexibility in cost, speed, and available collections.
● Security: Because trades are executed on-chain, OpenSea itself does not custody funds or NFTs. This reduces counterparty risk, though users must remain cautious of scams or phishing attempts.
This setup makes OpenSea function like a decentralized version of eBay for digital collectibles, accessible worldwide with only a wallet and an internet connection.
OpenSea (SEA) Tokenomics
The SEA token will serve as the native token of the OpenSea ecosystem, introducing both utility and governance to a marketplace that has until now relied mainly on transaction fees. Full supply and allocation details will be released at the token generation event in October 2025, but several elements are already known.
● Issuance: Overseen by the independent OpenSea Foundation.
● Distribution: Large airdrop for historical and current users, plus ongoing OS2 rewards.
● Reward Vault: 50% of platform fees diverted, with over $1 million in OP and ARB already set aside.
● Utility: Planned functions include fee discounts, exclusive feature access, and governance rights.
● Supply Details: Total supply and vesting schedules will be confirmed at TGE.
OpenSea Airdrop: Everything You Should Know
The SEA airdrop is central to OpenSea’s token launch. Instead of focusing only on new users or traders right before the listing, OpenSea has emphasized rewarding both historical activity and current engagement on its upgraded OS2 platform. This approach ensures that long-time community members are recognized, while active participation in the lead-up to the TGE can still increase allocations.
How Eligibility Works
● Historical Users: Anyone who has previously interacted with OpenSea—whether by buying, selling, listing, or bidding on NFTs—is included in the eligibility pool. Past usage will directly impact the base allocation of SEA.
● Current Users: OpenSea launched a final rewards phase running from mid-September to mid-October 2025. During this period, users can boost their airdrop share by taking part in structured activities.
The Final Rewards Phase
To make the process engaging, OpenSea introduced a gamified system built around Treasure Chests:
● Every eligible user receives a Starter Chest.
● Chests can be leveled up (up to level 12) by completing platform activities.
● Key activities include:
○ Trading NFTs or tokens across supported chains
○ Completing daily Voyages (missions that reward experience points)
○ Collecting Shipments, which drop randomly during the campaign
● Higher-level chests unlock larger allocations of SEA and, in some cases, additional NFT rewards.
Reward Vault
To back the program, OpenSea is diverting 50% of its platform fees into a reward vault. This vault already holds more than $1 million in Optimism (OP) and Arbitrum (ARB) tokens, which will be distributed alongside SEA. The vault ensures that rewards have tangible value beyond the token itself, and it underscores OpenSea’s commitment to creating a sustainable incentive system.
Steps for Users
To maximize rewards before the TGE:
● Link all active wallets to your OpenSea profile so activity is counted together.
● Continue trading NFTs and tokens organically, avoiding suspicious or artificial patterns.
● Check the rewards dashboard regularly to track your chest level and XP progress.
● Complete as many daily Voyages and tasks as possible to steadily raise your allocation.
For many investors, this is the easiest and most direct way to gain exposure to the new token.
When Is the OpenSea (SEA) Listing Date?
The token generation event (TGE) for SEA is scheduled for October 2025. OpenSea has confirmed that final tokenomics, claim details, and exchange listings will all be announced around that time. A snapshot of user activity will take place in early October to finalize airdrop allocations, with the claim process opening shortly after. Exchange listings are expected to follow quickly, making October the pivotal month when SEA shifts from reward promises to a live, tradable token.
SEA Token Price Prediction: What Could Happen After Launch?
Predicting the price of a new token is always uncertain, but a few scenarios are worth considering. On the optimistic side, OpenSea’s reputation as the largest NFT marketplace could create strong initial demand for SEA, especially with airdrop recipients eager to hold for governance and potential fee discounts. Early liquidity pools and listings on major exchanges may drive a short-term spike if buying pressure outweighs selling from airdrop claimants.
However, there are also risks. Large allocations to the community mean many holders could sell quickly to lock in gains, leading to volatility. Without clear long-term utility, SEA might struggle to maintain momentum once the initial hype fades. Much will depend on how OpenSea integrates the token into its ecosystem and whether trading volumes on the platform grow.
Analyst forecasts already vary: some expect SEA to trade near the $0.60–$0.70 range by late 2025, while others predict more modest values closer to $0.50. The takeaway is that SEA’s post-launch performance will likely mirror the broader sentiment in NFTs and crypto markets. Investors should be prepared for swings in the early days and focus on whether the token builds real, lasting use cases over time.
Conclusion
The SEA token launch represents a new chapter for OpenSea, transforming it from the leading NFT marketplace into a platform with its own token-powered ecosystem. By introducing airdrops, a reward vault, and governance functions, OpenSea is building stronger ties with its community while opening new possibilities for growth.
For investors, October 2025 is more than just a launch date. It is the point where OpenSea’s reputation, user base, and long term vision come together in a live token economy. If SEA fulfills its promise of utility and active participation, it has the potential to become a lasting part of the Web3 landscape and a meaningful step forward for both OpenSea and its users.
Disclaimer: The opinions expressed in this article are for informational purposes only. This article does not constitute an endorsement of any of the products and services discussed or investment, financial, or trading advice. Qualified professionals should be consulted prior to making financial decisions.
Học viện Bitget2025-09-25 16:15
Mua ISP trên Bitget trong 3 bước đơn giản

Đăng ký tài khoản Bitget miễn phí
Đăng ký trên Bitget bằng địa chỉ email/số điện thoại di động của bạn và tạo mật khẩu mạnh để bảo mật tài khoản.

Xác minh tài khoản của bạn
Xác minh danh tính bằng cách nhập thông tin cá nhân của bạn và tải lên giấy tờ tùy thân có ảnh hợp lệ.

Mua ISP (ISP)
Sử dụng nhiều tùy chọn thanh toán khác nhau để mua ISP trên Bitget. Chúng tôi sẽ hướng dẫn bạn cách thực hiện.
Mua thêm tiền điện tử
Hướng dẫn cách mua
Bitcoin (BTC)

Hướng dẫn cách mua
Ethereum (ETH)

Hướng dẫn cách mua
Ripple (XRP)

Hướng dẫn cách mua
Tron (TRX)

Hướng dẫn cách mua
Dogecoin (DOGE)

Hướng dẫn cách mua
Tezo (XTZ)

Hướng dẫn cách mua
Bitget Token (BGB)

Hướng dẫn cách mua
Polygon (POL)

Hướng dẫn cách mua
Solana (SOL)

Hướng dẫn cách mua
Terra Classic (LUNC)

Hướng dẫn cách mua
Fantom (FTM)

Hướng dẫn cách mua
Bitcoin Cash (BCH)

Hướng dẫn cách mua
Ethereum Classic (ETC)

Hướng dẫn cách mua
Litecoin (LTC)

Hướng dẫn cách mua
Binance (BNB)

Hướng dẫn cách mua
Avalanche (AVAX)

Hướng dẫn cách mua
Internet Computer (ICP)

Hướng dẫn cách mua
Tether (USDT)

Hướng dẫn cách mua
USDC (USDC)

Hướng dẫn cách mua
Uniswap (UNI)

Xem thêm
Dự đoán giá coin thịnh hành
 Dự đoán giá Dogecoin
 Dự đoán giá Pepe
 Dự đoán giá Cardano
 Dự đoán giá Bonk
 Dự đoán giá Toncoin
 Dự đoán giá Pi
 Dự đoán giá Fartcoin
 Dự đoán giá Bitcoin
 Dự đoán giá Litecoin
 Dự đoán giá WINkLink
 Dự đoán giá Solana
 Dự đoán giá Stellar
 Dự đoán giá XRP
 Dự đoán giá OFFICIAL TRUMP
 Dự đoán giá Ethereum
 Dự đoán giá Worldcoin
 Dự đoán giá dogwifhat
 Dự đoán giá Kaspa
 Dự đoán giá Smooth Love Potion
 Dự đoán giá Terra
Tôi có thể mua Ispolink (ISP) ở đâu?
Xét về tính biến động vốn có và sự phức tạp của thị trường tiền điện tử, việc dự đoán chính xác giá tương lai của các loại tiền điện tử gần như là điều không thể. Tuy nhiên, dựa trên bản chất chu kỳ của thị trường, các xu hướng giá trong quá khứ, triển vọng phát triển dài hạn và với tiềm năng được chấp nhận rộng rãi hơn, chúng ta vẫn có thể đưa ra một số dự đoán tổng quan về xu hướng giá trong tương lai. Đồng thời, cũng cần lưu ý rằng dù những dự báo này có thể cung cấp thông tin về các vùng giá tiềm năng và các kịch bản thị trường, chúng nên được xem xét một cách thận trọng và hoài nghi. Biến động giá thực tế khó có thể trùng khớp hoàn toàn với các dự báo này và chúng chỉ nên được xem là các ước tính sơ bộ về tiềm năng đầu tư của thị trường.
Nội dung được cung cấp chỉ mang tính chất thông tin và không được xem là lời chào mời, đề xuất hay khuyến nghị của Bitget về việc mua, bán hoặc nắm giữ bất kỳ cổ phiếu, sản phẩm tài chính hoặc công cụ nào được đề cập trong nội dung này và cũng không phải phải là tư vấn đầu tư, tư vấn tài chính, tư vấn giao dịch hoặc bất kỳ hình thức tư vấn nào khác. Dữ liệu được hiển thị có thể phản ánh giá tài sản được giao dịch trên sàn giao dịch Bitget cũng như các sàn giao dịch tiền điện tử và nền tảng dữ liệu thị trường khác. Bitget có thể tính phí xử lý các giao dịch tiền điện tử, và phí này có thể không được hiển thị ở giá chuyển đổi. Bitget không chịu trách nhiệm pháp lý đối với bất kỳ lỗi hoặc sự chậm trễ nào về nội dung, hoặc bất kỳ hành động nào dựa trên nội dung đó.
Nội dung được cung cấp chỉ mang tính chất thông tin và không được xem là lời chào mời, đề xuất hay khuyến nghị của Bitget về việc mua, bán hoặc nắm giữ bất kỳ cổ phiếu, sản phẩm tài chính hoặc công cụ nào được đề cập trong nội dung này và cũng không phải phải là tư vấn đầu tư, tư vấn tài chính, tư vấn giao dịch hoặc bất kỳ hình thức tư vấn nào khác. Dữ liệu được hiển thị có thể phản ánh giá tài sản được giao dịch trên sàn giao dịch Bitget cũng như các sàn giao dịch tiền điện tử và nền tảng dữ liệu thị trường khác. Bitget có thể tính phí xử lý các giao dịch tiền điện tử, và phí này có thể không được hiển thị ở giá chuyển đổi. Bitget không chịu trách nhiệm pháp lý đối với bất kỳ lỗi hoặc sự chậm trễ nào về nội dung, hoặc bất kỳ hành động nào dựa trên nội dung đó.