Date: Fri, Nov 21, 2025 | 08:55 AM GMT
The cryptocurrency market continues to face heavy selling pressure as both Bitcoin (BTC) and Ethereum (ETH) plunged over 9% in the past 24 hours. The correction triggered more than $1.93 billion in liquidations across the market, with long positions taking the biggest hit — over $1.83 billion wiped out in a single day.
This intense volatility has weighed heavily on major altcoins, including Avalanche (AVAX), which is down more than 7%. But beneath the surface of this decline, the chart reveals a technical structure that may be positioning AVAX for a potential rebound in the coming weeks.
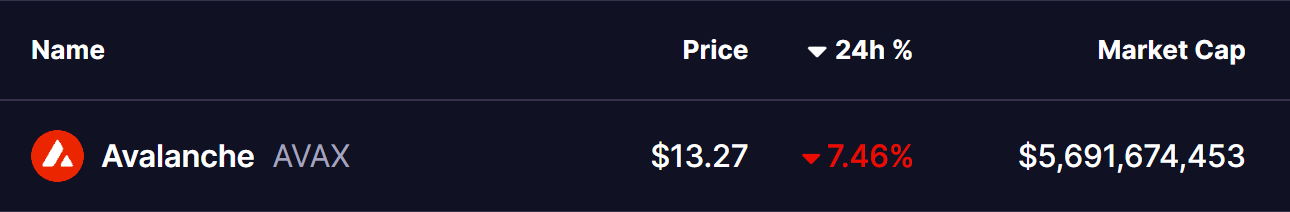 Source: Coinmarketcap
Falling Wedge Pattern in Play
On the weekly chart, AVAX is trading within a falling wedge pattern — a structure that historically carries bullish implications. Falling wedges typically indicate that selling pressure is weakening over time, even as price makes lower highs and lower lows, compressing into a tighter range before a potential breakout.
As shown in the chart, the recent drop pulled AVAX directly toward the lower boundary of the wedge near $12.57 — the same support region that previously generated immediate bounce reactions. Once again, sellers appear to be losing momentum at this level, and early signs of accumulation are starting to emerge.
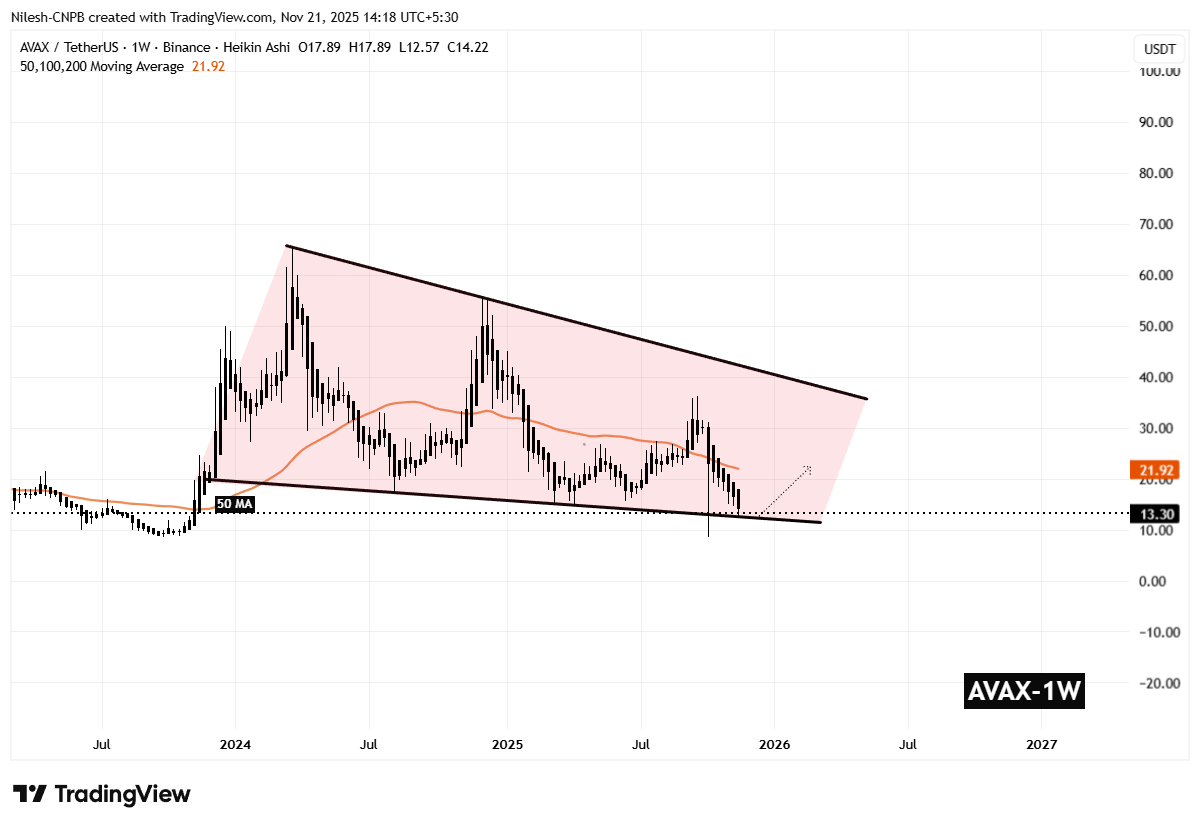 Avalanche (AVAX) Weekly Chart/Coinsprobe (Source: Tradingview)
Repeated touches of the wedge’s lower boundary and immediate recoveries hint that buyers are quietly stepping in each time price dips into this zone.
What’s Next for AVAX?
If AVAX continues to defend this support area and sustains strength along the wedge’s boundary, upward momentum could begin building. The next key resistance to watch sits at the 50-week moving average around $21.92, which historically has played a significant role in rejecting upward pushes.
A breakout above this moving average could fuel stronger bullish sentiment and potentially open the path toward the upper wedge resistance trendline — a level that would mark a shift in market structure.
However, the bullish scenario hinges on AVAX maintaining support at current levels. A decisive breakdown below the wedge floor would invalidate the setup and risk deeper downside continuation toward the $9.00 zone, where the next major support rests.