- ETH holds a long rising support line, while the chart shows a full five-wave structure that leads toward a $16,528 target.
- ETH forms a deep second wave at the $2,734 area, and this shape sets the base for the strong climb drawn in the chart.
- ETH displays strong volume zones near $3,10,0 and this field helps guide the early part of the next major wave push.
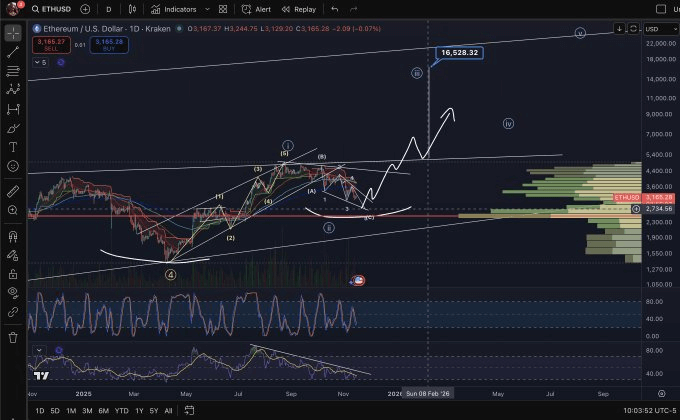
ETH trades within a rising channel as the current wave count signals a long route toward a $16,528 level marked as the next major objective. The chart displays a full Elliott structure that includes a completed wave one and a corrective pullback that forms the base of wave two. The volume profile supports the range near $2,734, and the map draws a steady climb toward the upper region of the wide channel.
 Source: X
The central question now emerges for market watchers: can ETH maintain its wave structure long enough to reach the projected $16,528 mark?
Wave Count Shows Completed First Cycle and a Deep Second Phase
The chart reveals that ETH finished a clear five-wave move into the region above $4,000 before entering a structured correction. The correction appears in the form of an A B C sequence that travels from the upper range toward the lower channel support. A labelled second wave rests across the red horizontal line near $2,734.56 and acts as the foundation for the next advance.
Additional subwave notations show a set of one to five marks inside the downward correction. This layout signals a refined internal count and aligns with typical wave two behaviour. The shape of the curve drawn under the low suggests an area where buying interest may appear as the correction is complete. The time marker shows a point near early February 2026 that connects with the next projected phase.
This larger framework guides the movement toward the rising trend line drawn from earlier cycle lows. That trend line supports the idea that the second wave remains inside a larger bullish structure.
Wave Three Projection Points to $16,528 as Channel Lines Expand
The path for wave three is drawn with a strong upward route that leads toward the $16,528 target. This number is placed near the upper channel boundary and lines up with the long-term trend structure. The dotted vertical line marks a time point during 2026 that aligns with the wave three label on the chart. The structure shows several upward swings inside the wave as part of its internal count.
 Source: X
The channel that surrounds this movement spans from the lower support line under the wave two floor to the upper resistance line shown above $20,000. The path toward $16,528 sits below the full boundary but remains inside the region defined by past reactions. This range suggests that wave three may produce strong moves if volume returns during the climb.
Short-term movements show a small corrective pattern that wraps around the end of wave two. These inner waves mark the early stages of a new advance and match the behaviour expected at the start of a large impulsive wave.
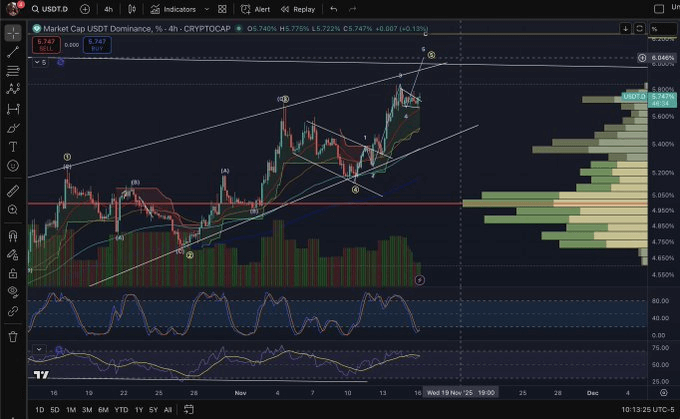
USDT Dominance Chart Adds Context to ETH Structure
The USDT dominance chart supports the ETH framework by showing a nearly completed five-wave move of its own. The structure climbs through a narrow channel with a fifth wave projected toward the 6.046 percent region. This setup often connects with broader market conditions where dominance peaks as major assets complete corrections.
Dominance movements show internal waves and a set of corrective shapes across the middle of the chart. The volume profile displays clear steps near 5.4 and 5.0 percent that relate to earlier reactions. The line drawn under the structure shows rising support that may break once the fifth wave ends.
A decline in USDT dominance after its fifth wave peak may open favourable space for ETH to activate its upward wave three path toward the $16,528 region.