VIRTUAL Price on the Verge of a Breakout? 3 Bullish Signs Say “Yes”

Virtuals Protocol (VIRTUAL) has exploded nearly 88% in the past week but has since moved sideways near $1.45. That might look like a pause after a big rally, but under the surface, several indicators are flashing bullish for the VIRTUAL price.
Three strong signs show that the token could be preparing for another leg up.
Flag Pattern Holds Firm as Divergence Signals Strength: The First Bullish Sign
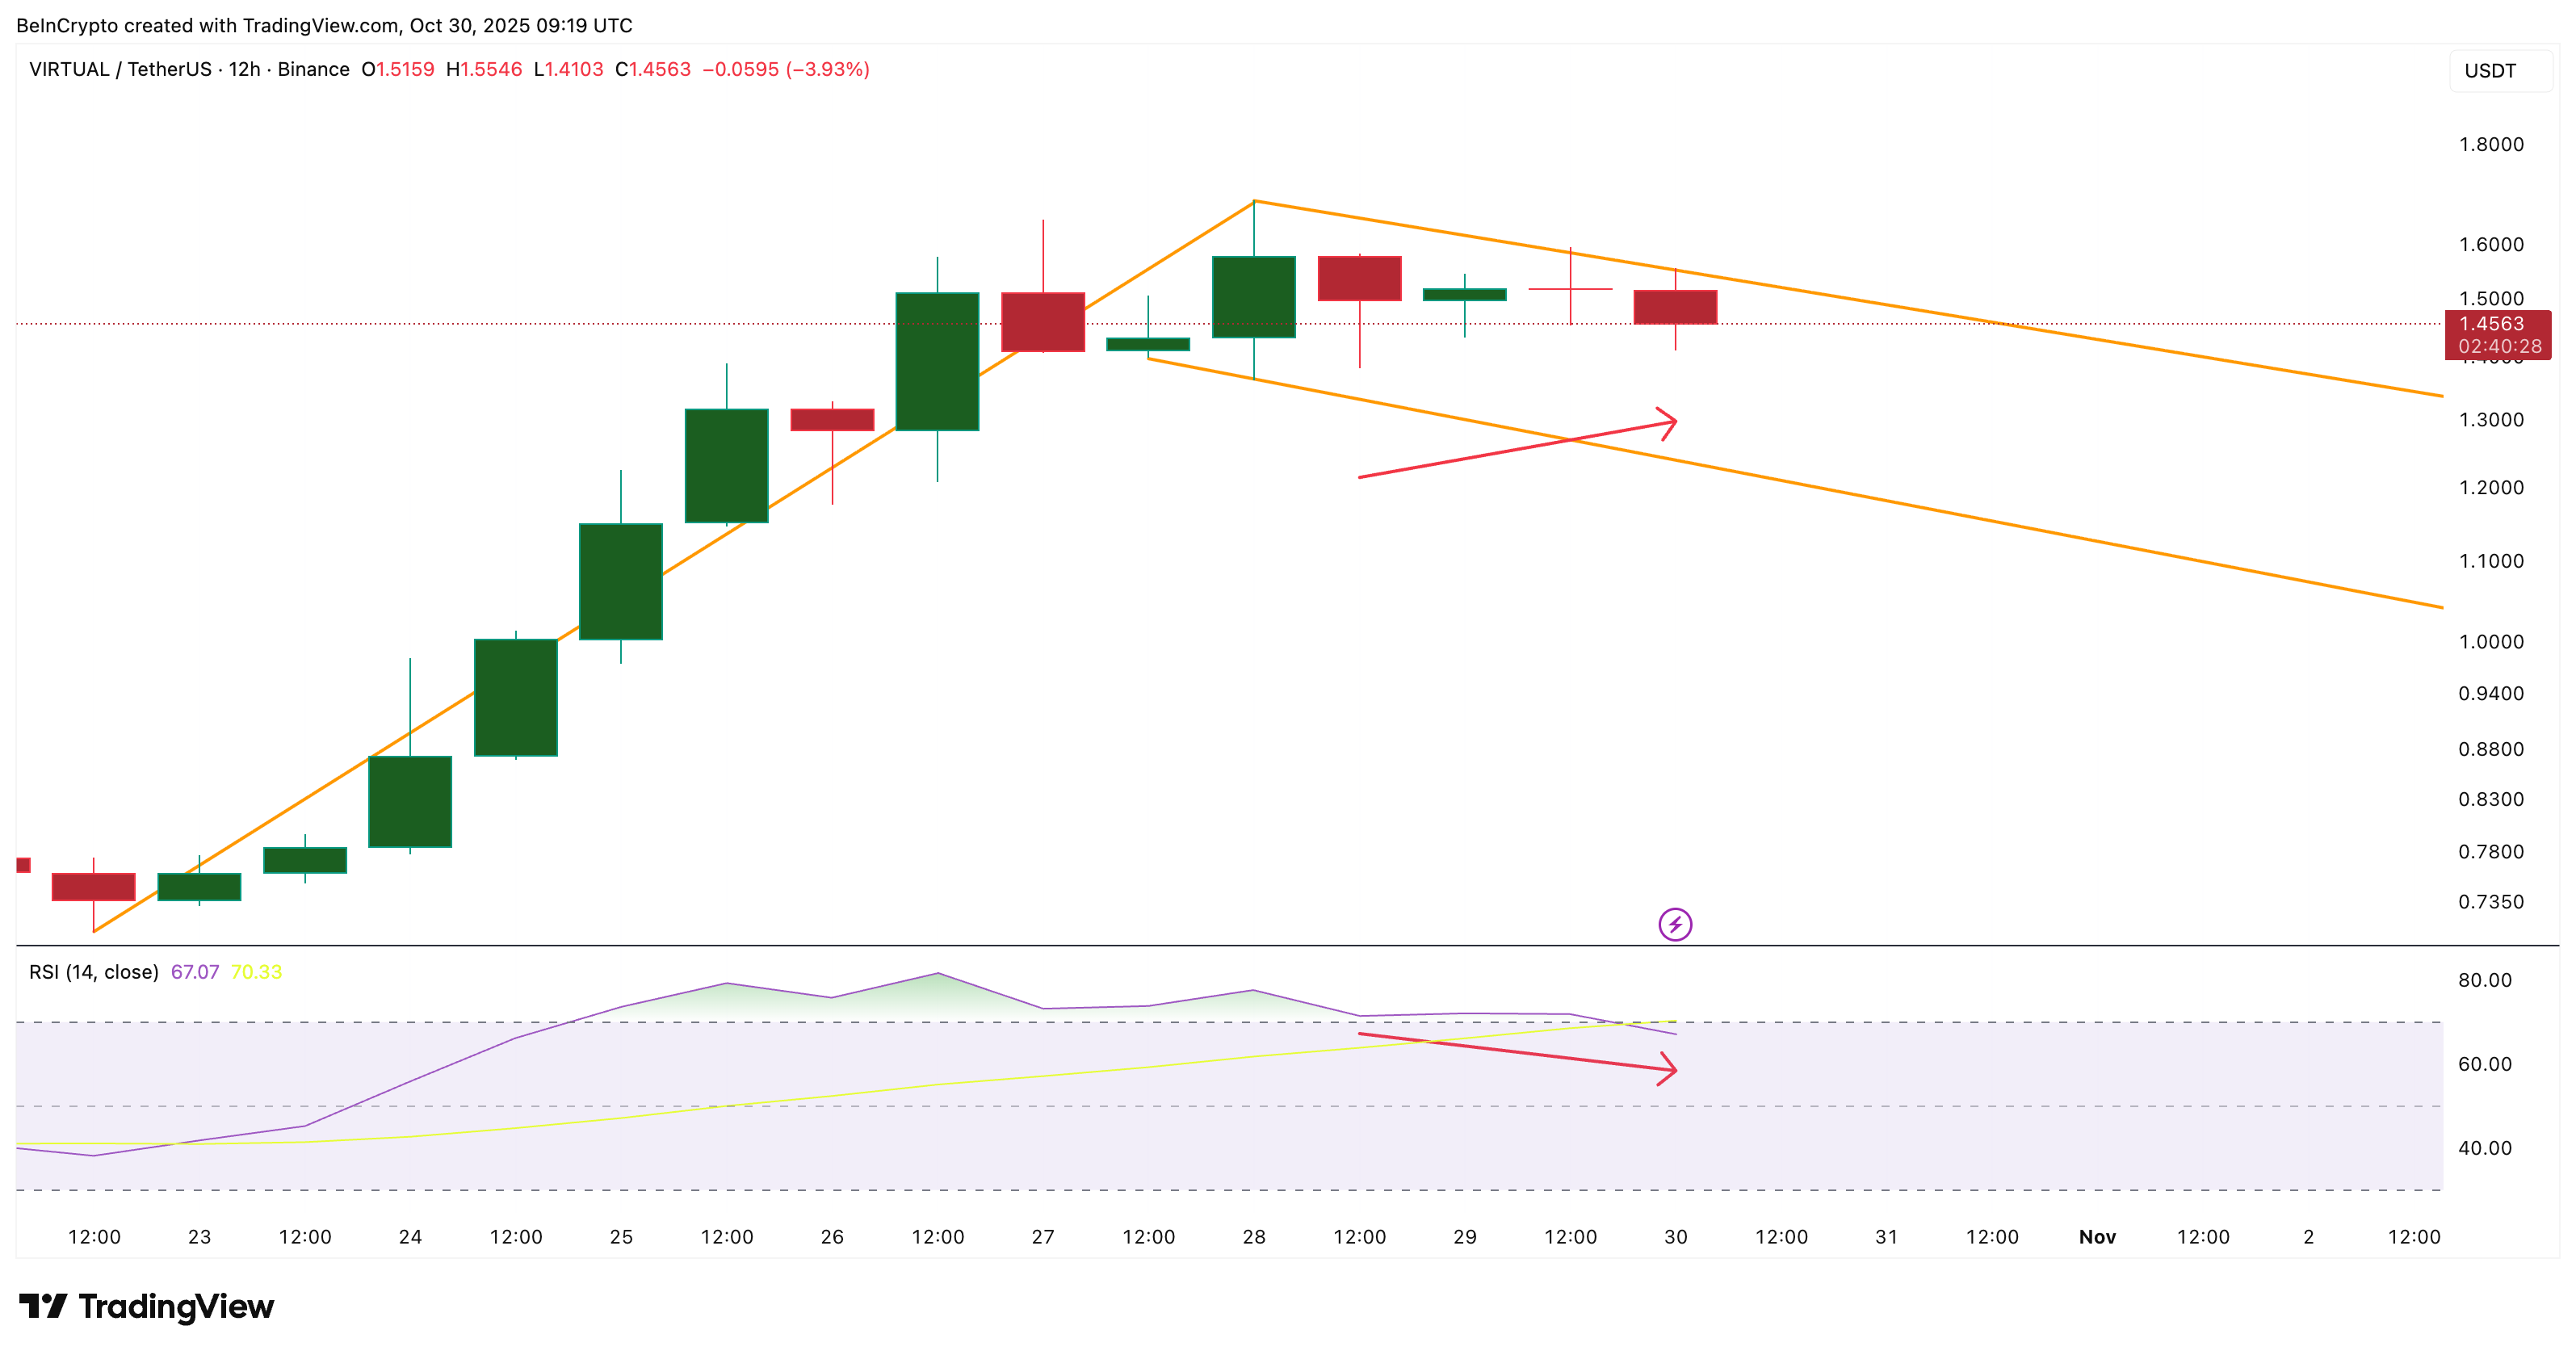
On the 12-hour chart, VIRTUAL is consolidating inside a bullish flag (pole and flag) pattern, which forms after a steep rally when traders pause before pushing higher. The pattern is tightening near the upper trendline, hinting that pressure is building for a breakout.
Between October 28 and 30, the token’s price made a higher low, while the Relative Strength Index (RSI) made a lower low. This phenomenon, termed hidden bullish divergence, happened during the flag-based consolidation.
RSI measures buying versus selling strength. And in VIRTUAL’s case, it hints at bullish continuation. In short, sellers are losing control even though price growth has slowed.
Want more token insights like this? Sign up for Editor Harsh Notariya’s Daily Crypto Newsletter here.
If VIRTUAL breaks above the flag’s upper trendline, the setup could confirm a new uptrend. But the breakout hopes aren’t random, and we have another bullish sign next.
Moving Averages Add Weight to the Breakout Case: The Second Sign
Adding to the bullish pressure, the 50-period Exponential Moving Average (EMA) is about to cross above the 100-period EMA.
The EMA smooths out price data to highlight recent momentum trends. When a shorter EMA crosses above a longer one, it often marks the start of a new bullish phase.
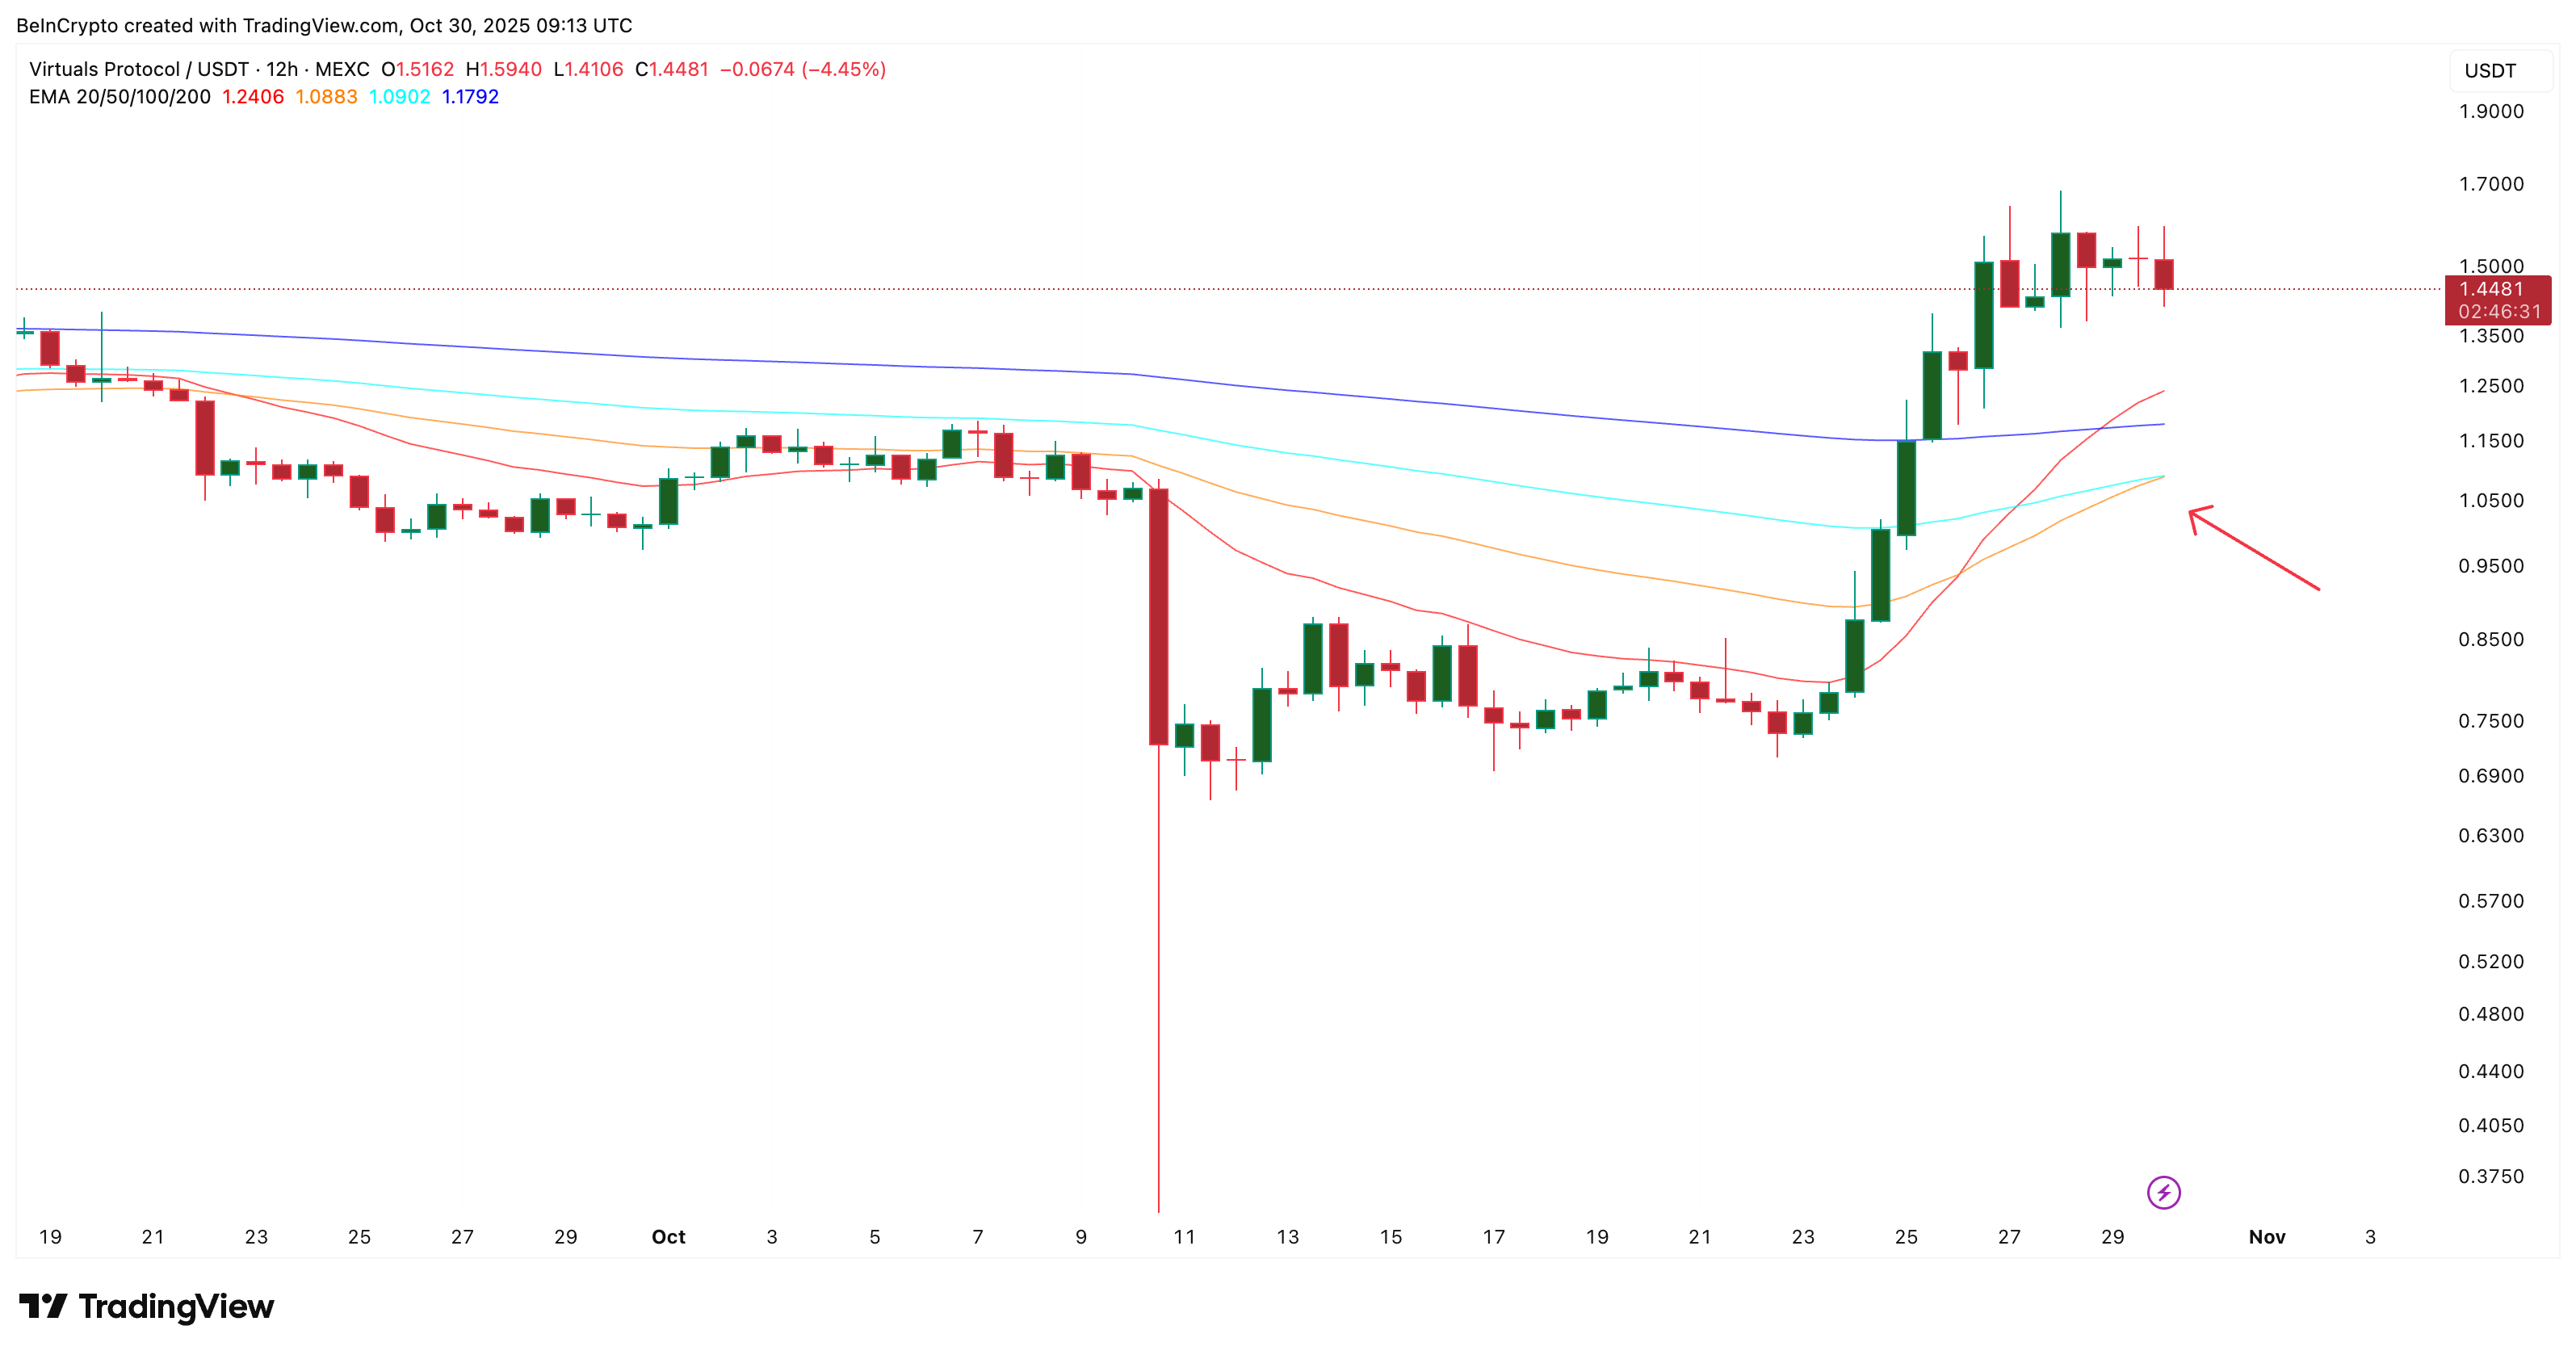
This crossover comes right as VIRTUAL’s price tests the upper flag boundary. It is a rare alignment that reinforces the breakout hypothesis. If both the EMA crossover and a close above the upper trendline happen together, it could act as a double confirmation of strength.
Smart Money Builds Positions Ahead of the VIRTUAL Price Move: The Third Sign
While retail traders might be waiting for clearer signals, smart money — the term used for experienced or institutional investors — is already showing its hand.
The Smart Money Index (SMI), which tracks the flow of funds from informed traders, has been trending higher since early October, despite a few dips along the way. The index has made higher highs consistently, even as prices consolidate, suggesting quiet accumulation behind the scenes.
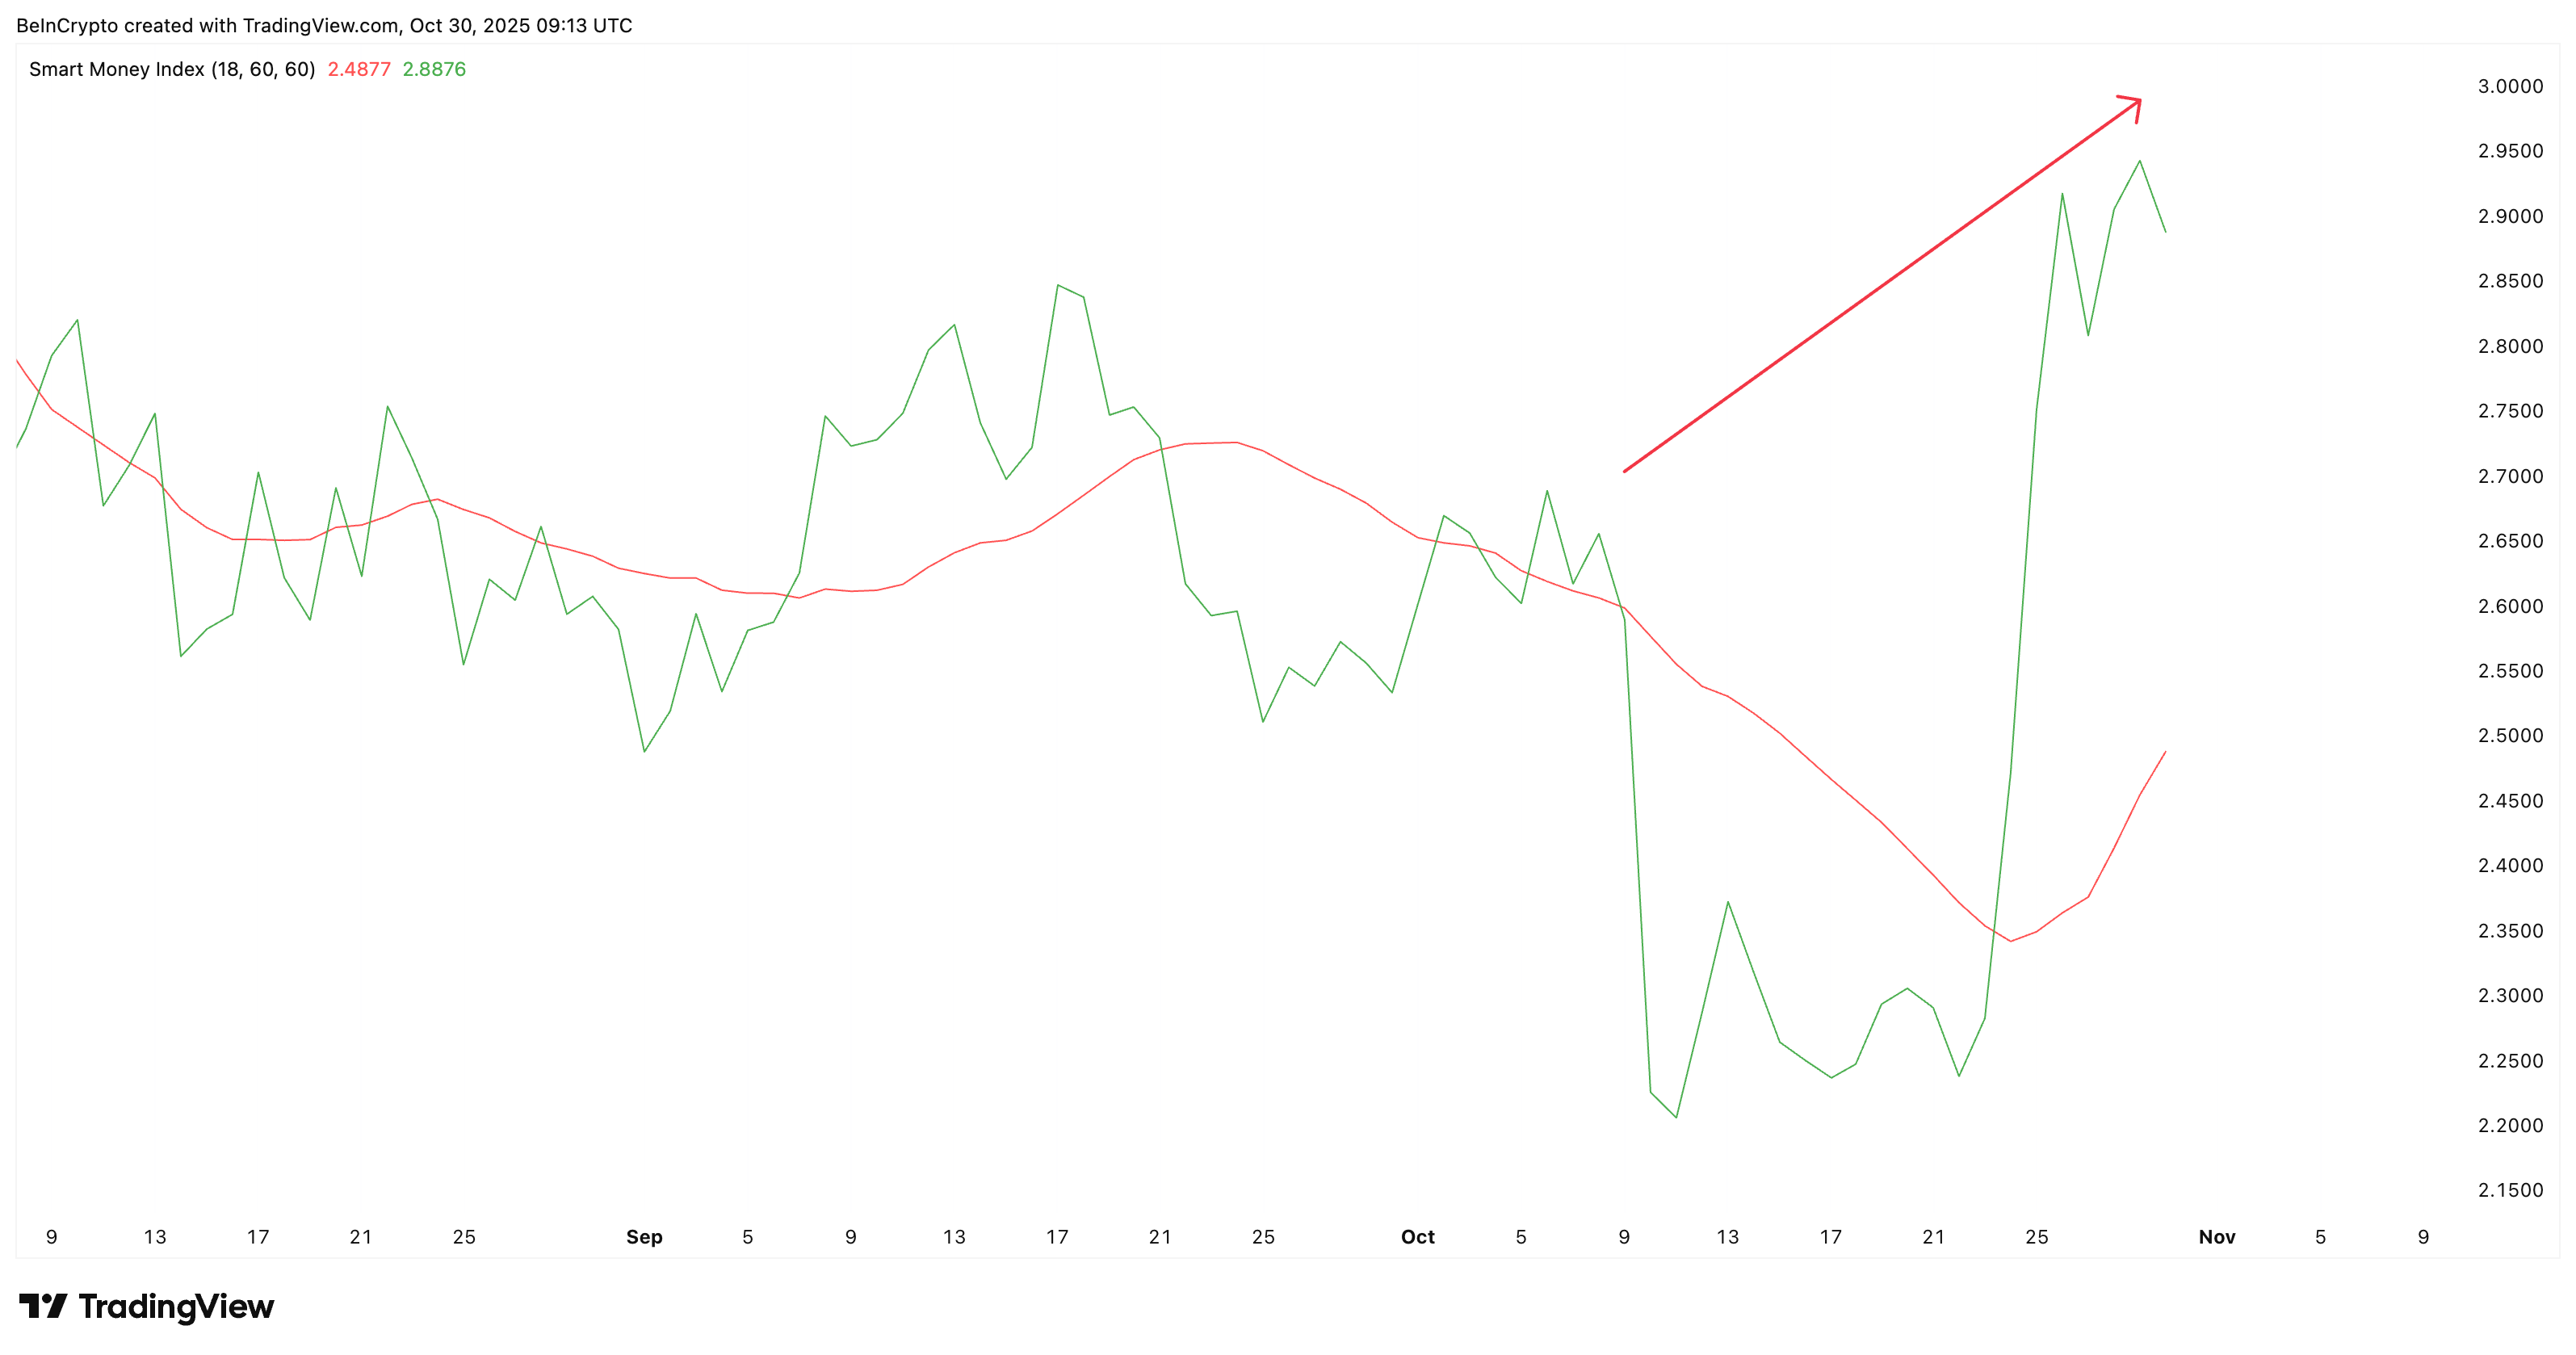
This increase in smart money activity typically precedes price expansion, suggesting that big players expect the flag to resolve higher.
If the VIRTUAL breakout above $1.60 holds, potential upside targets lie at $3.61 (per pole projection) and $3.92, according to Fibonacci projections. However, post the breakout, VIRTUAL might find the strongest resistance near $1.97 (right before the psychological barrier of $2) and $2.95 (ahead of $3).
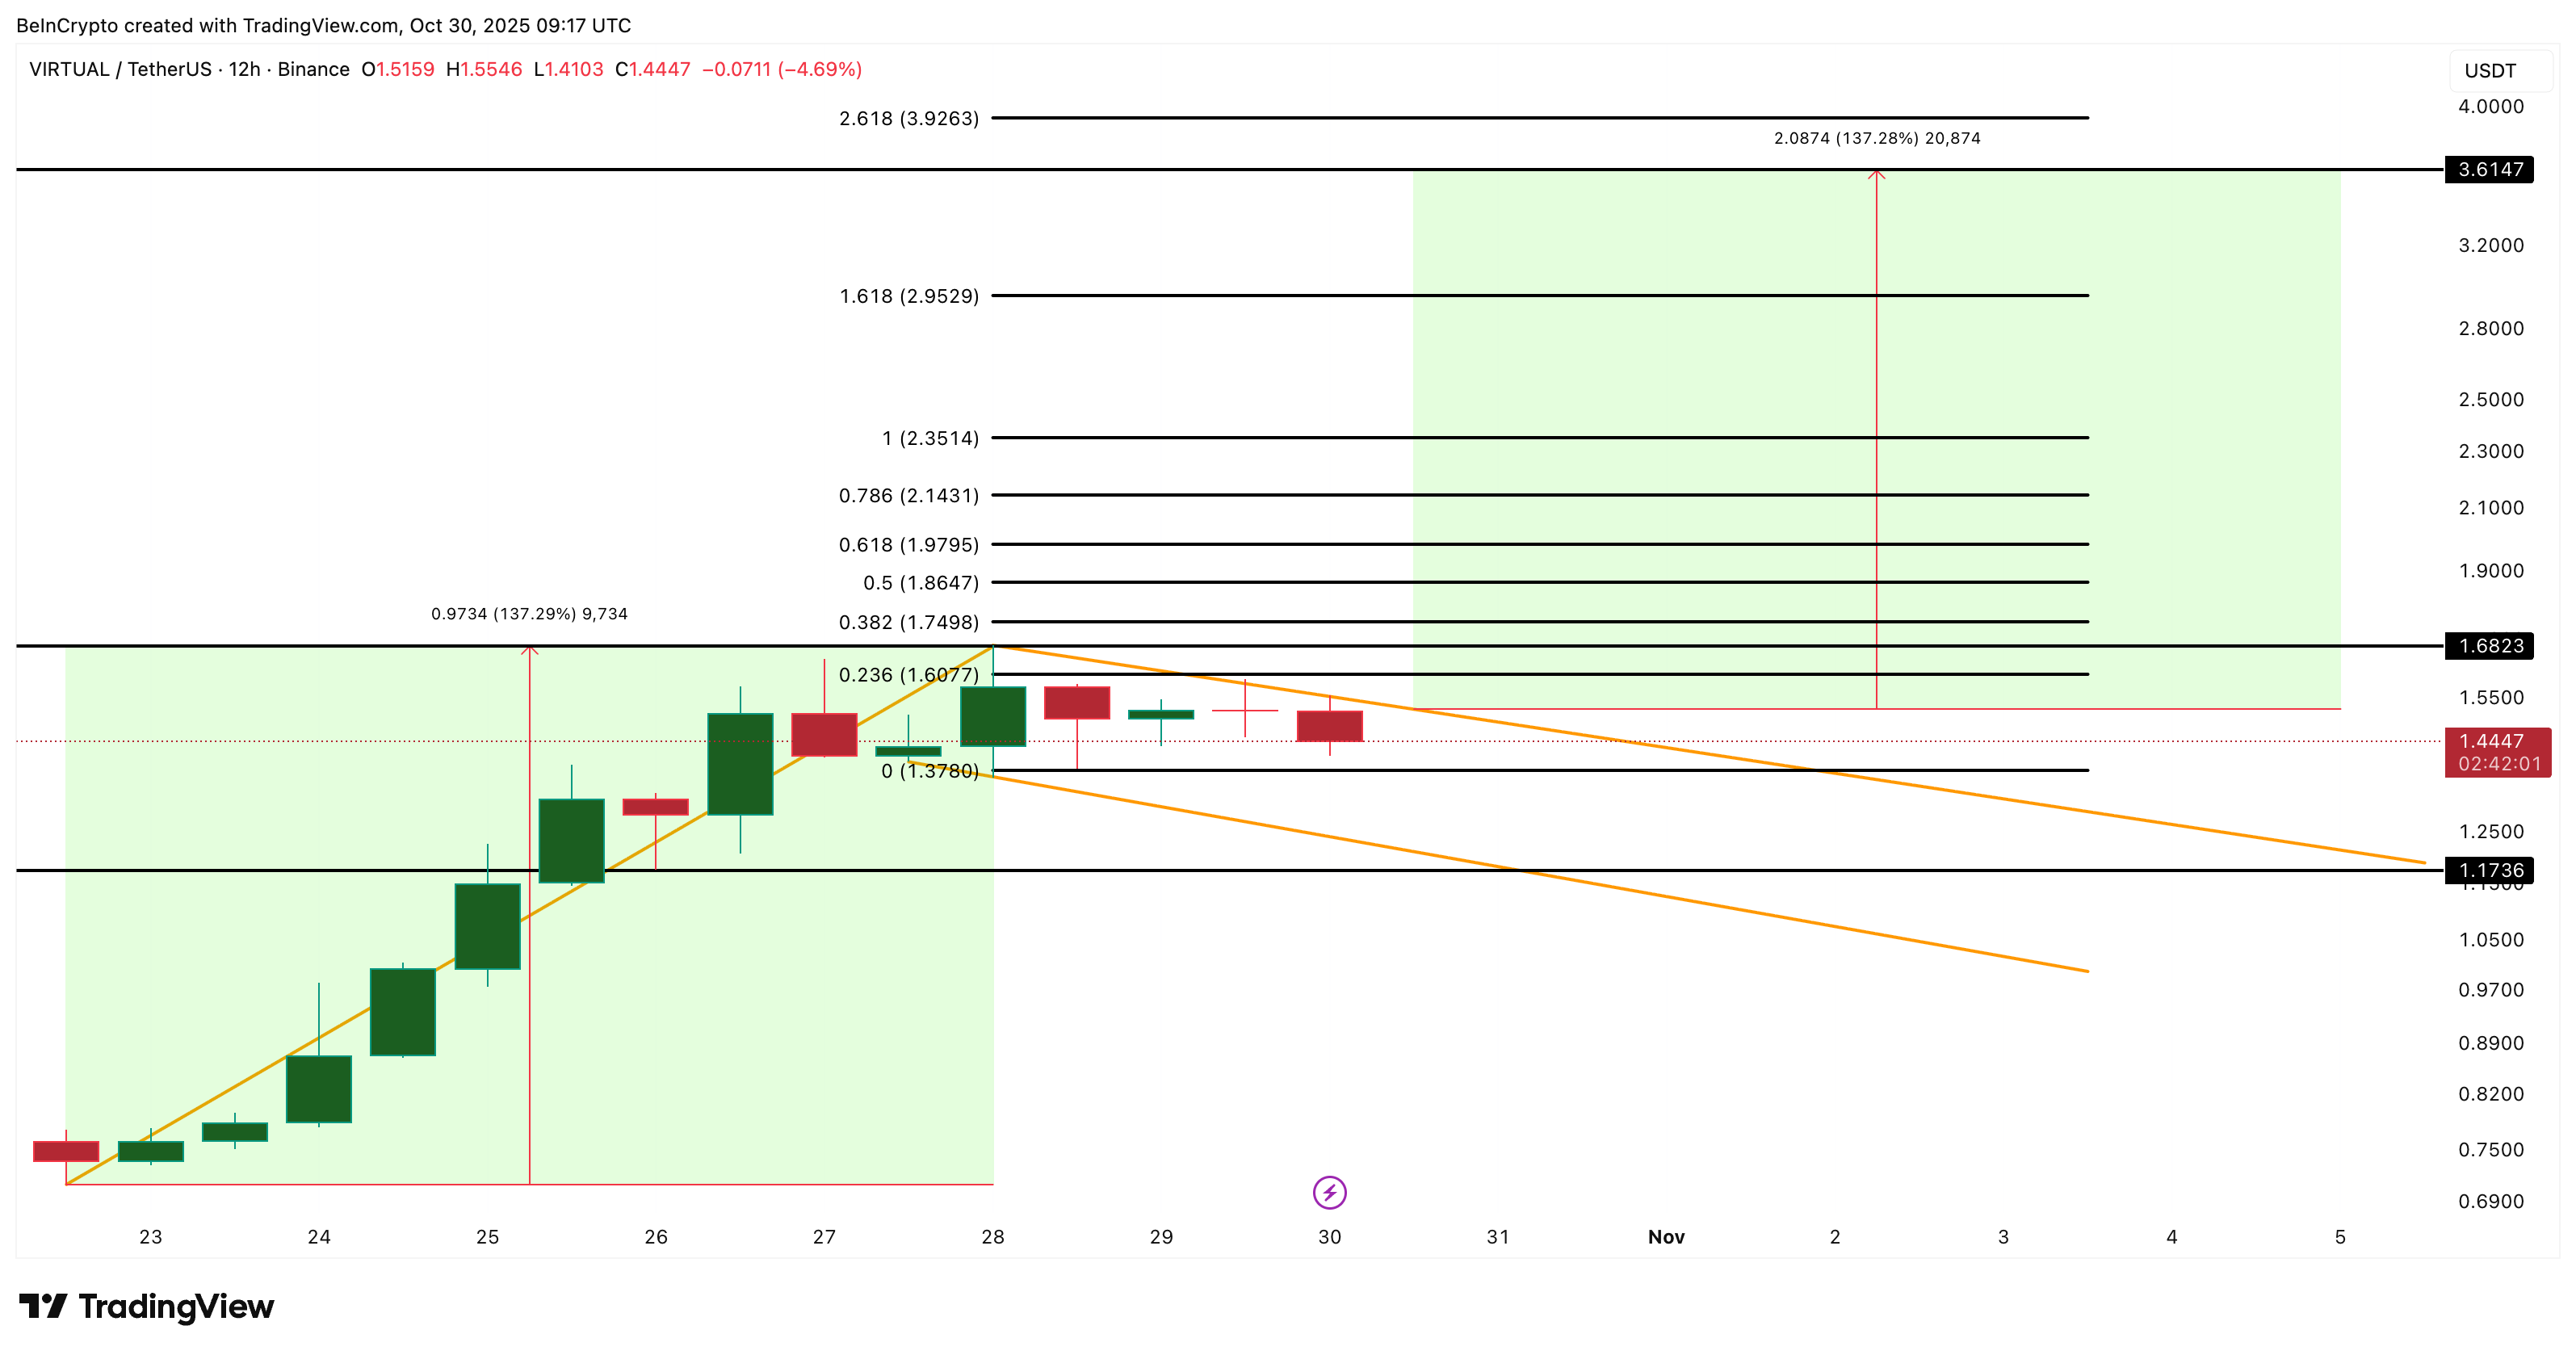
That said, if support at $1.37 followed by $1.17 breaks, it would likely invalidate this setup. That would signal a longer consolidation phase instead.
The post VIRTUAL Price on the Verge of a Breakout? 3 Bullish Signs Say “Yes” appeared first on BeInCrypto.
Disclaimer: The content of this article solely reflects the author's opinion and does not represent the platform in any capacity. This article is not intended to serve as a reference for making investment decisions.
You may also like
569 XRP Whales Disappear—Yet Whale Holdings Hit 7-Year High. What’s Going On?
![Crypto News Today [Live] Updates On December 2,2025 : Federal Reserve News, Bitcoin Price Today, Ethereum Price And XRP Price](https://img.bgstatic.com/multiLang/image/social/cc963d16638fb3fac964f28463fe5c9a1764673944776.webp)
Pi Network Flashback: Did the Founder Reveal When Pi Coin Will Actually Start Rising?
HashKey prospectus in detail: 1.5 billion HKD loss over three years, 43% equity controlled by Wanxiang Chairman Lu Weiding
Despite HashKey's significant total revenue growth over the past two years, with rapid expansion in trading volume and client base, the underlying financial pressure remains evident: ongoing losses, long-term negative operating cash flow, and consistently high net debt all contribute to continued uncertainty regarding its financial resilience ahead of its IPO.