Solana’s recent cup and handle pattern indicates a potential breakout at $215, targeting a price of $3,500 if confirmed. Analysts highlight significant address growth and whale accumulation as key factors driving this momentum.
-
Solana forms a multi-year cup and handle pattern, with a $215 neckline key for breakout.
-
Closing above the neckline on the 2-month chart activates the $3,500 target, say analysts.
-
On-chain data shows 51% address growth and rising whale accumulation, boosting momentum.
Solana price analysis reveals a potential breakout at $215, targeting $3,500. Stay updated on market trends!
What is the Cup and Handle Pattern in Solana?
The cup and handle pattern in Solana is a technical formation observed on its two-month chart, indicating a bullish trend. If Solana closes above the $215 neckline, a price target of $3,500 could be activated.
How Does Solana’s Market Activity Support This Pattern?
Solana’s market activity shows a robust trading volume of $4.13 billion and a market cap exceeding $103 billion. The growth of new addresses by 51% since August 3 indicates increased retail participation, while institutional demand is also rising.
Frequently Asked Questions
What does the cup and handle pattern indicate for Solana?
The cup and handle pattern suggests a bullish trend, with potential for significant price increases if the neckline is breached.
How can I track Solana’s price movements?
To track Solana’s price movements, monitor its trading volume, market cap, and technical indicators like RSI and MACD.
Key Takeaways
- Cup and Handle Pattern: Indicates potential bullish breakout at $215.
- Market Activity: $4.13 billion in trading volume supports price momentum.
- On-Chain Data: 51% growth in new addresses suggests increasing retail interest.
Conclusion
In summary, Solana’s cup and handle pattern, combined with strong market activity and on-chain data, positions it for a potential breakout. If the price closes above the $215 neckline, a target of $3,500 could be on the horizon, making it a critical moment for traders and investors alike.
Solana forms a multi-year cup and handle on the 2-month chart, with a $215 breakout level that could activate a $3,500 target.
- Solana forms a multi-year cup and handle pattern, with a $215 neckline key for breakout.
- Closing above the neckline on the 2-month chart activates the $3,500 target, say analysts.
- On-chain data shows 51% address growth and rising whale accumulation, boosting momentum.
Solana has shown steady recovery from past lows, and its long-term chart presents a technical formation that could define future price movement. Analysts point to a cup and handle structure visible on the two-month timeframe. If Solana closes above the neckline during this bimonthly candle, the projected target stands near $3,500.
Cup and Handle Structure on SOL Two-Month Chart
Solana’s cup formation stretched from late 2021 to mid-2023, with the neckline set around $215, according to analysis prepared by Trader Tardigrade. Following this phase, a handle structure formed through 2024 and early 2025, keeping the technical setup intact.
$SOL/2-month
If #Solana closes above the neckline in this bimonthly candle, the target is set at $3,500 🚀 pic.twitter.com/If6sEwvCcM
— Trader Tardigrade (@TATrader_Alan) August 16, 2025
The measurement of the pattern is calculated by applying the depth of the cup above the neckline. This provides a projected move toward $3,500 if a confirmed breakout occurs. According to an observation by market analysts, the handle represents a period of consolidation before a potential continuation of the long-term uptrend.
Solana traded at $192.04 during the latest session, gaining 3.1% in 24 hours. Against Bitcoin, SOL was priced at 0.001624 BTC. The price movement has tested the neckline area several times, and traders are now watching for a close above this level on the two-month chart.
Market Activity and On-Chain Developments
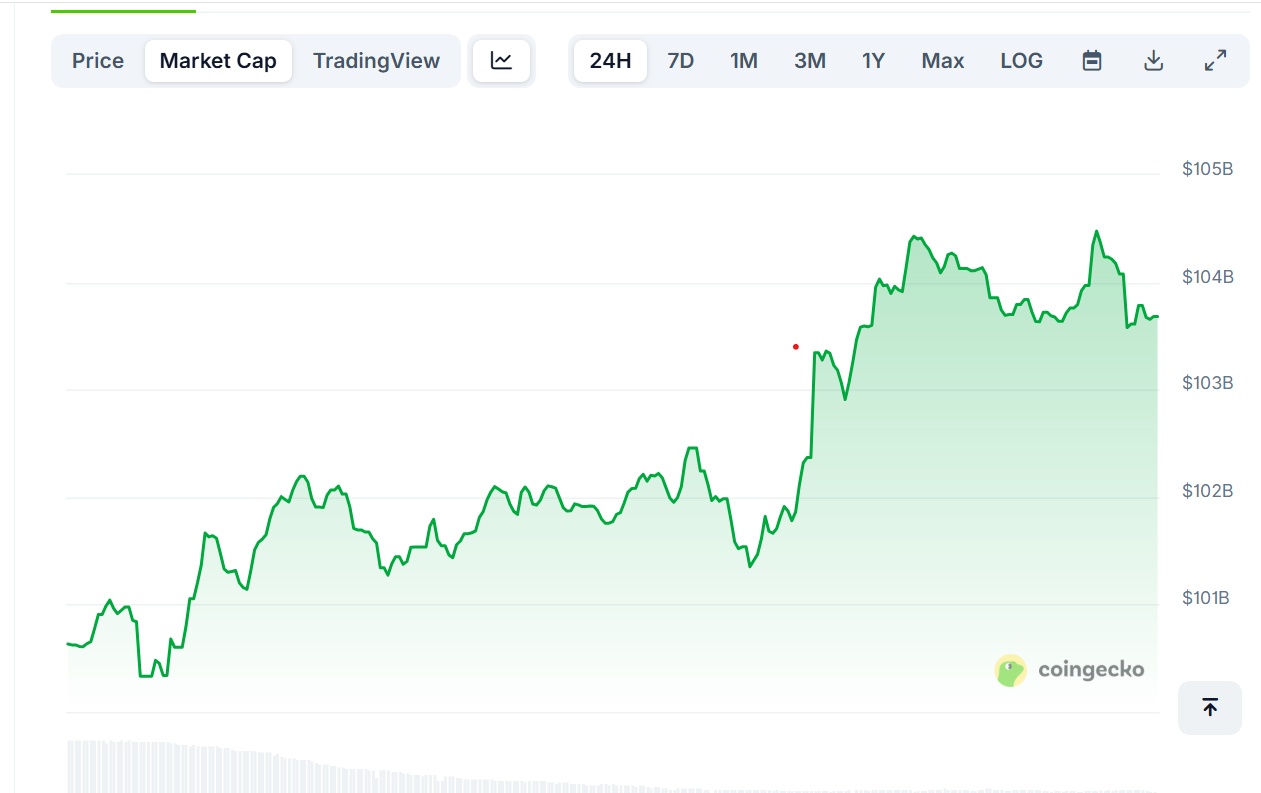
Trading activity has remained high, with $4.13 billion in 24-hour volume and market capitalization above $103 billion. Circulating supply stands at 539.92 million SOL, while total supply is 607.61 million SOL. Market cap trends show steady recovery with minor pullbacks followed by renewed strength.
According to Glassnode data, new Solana addresses increased by 51% since August 3, signaling growing retail participation. Institutional demand has also grown, with wallets holding over 10,000 SOL reaching a record 5,224. Analysts view this accumulation pattern as supportive of long-term market stability.
Technical readings support the current momentum. The RSI at 60 indicates room for further upside, while the MACD trend remains positive. If price closes above $215 on the bimonthly candle, the classical pattern target of $3,500 becomes active.