BTC bull market rhythm revealed: key indicators show that the bull market has passed 250 days, how far is the top?

Disclaimer: The content of this article solely reflects the author's opinion and does not represent the platform in any capacity. This article is not intended to serve as a reference for making investment decisions.
You may also like
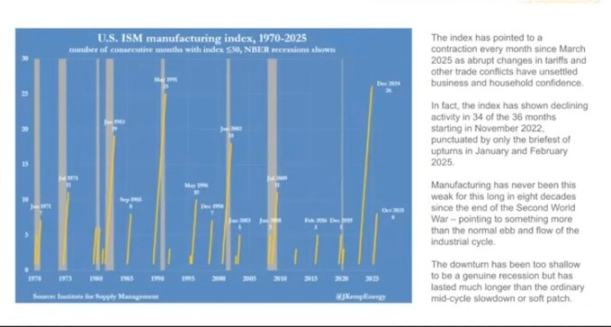
As economic cracks deepen, bitcoin may become the next liquidity "release valve"
The US economy is showing a divided state, with financial markets booming while the real economy is declining. The manufacturing PMI continues to contract, yet the stock market is rising due to concentrated profits in technology and financial companies, resulting in balance sheet inflation. Monetary policy struggles to benefit the real economy, and fiscal policy faces difficulties. The market structure leads to low capital efficiency, widening the gap between rich and poor and increasing social discontent. Cryptocurrency is seen as a relief valve, offering open financial opportunities. The economic cycle oscillates between policy adjustments and market reactions, lacking substantial recovery. Summary generated by Mars AI. The accuracy and completeness of this summary are still being iteratively updated by the Mars AI model.

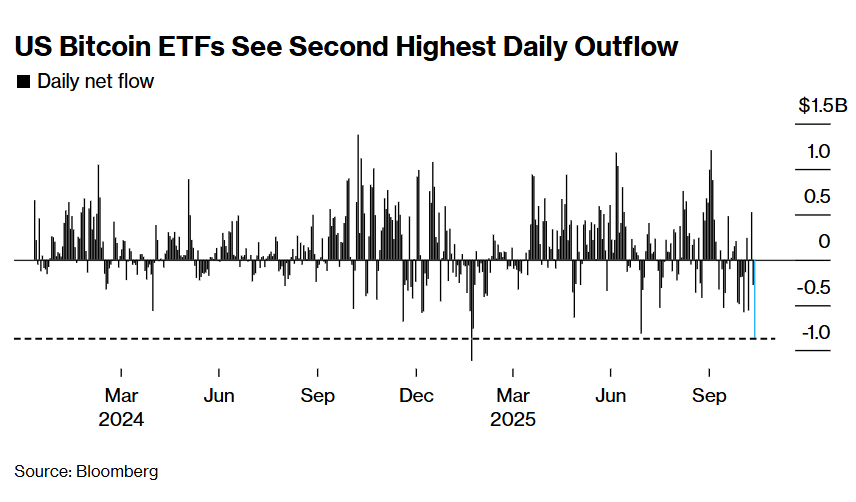
The wave of cryptocurrency liquidations continues! US Bitcoin ETF sees second highest single-day outflow in history
Due to the reassessment of Federal Reserve rate cut expectations and the fading rebound of the U.S. stock market, the crypto market continues to experience liquidations, with significant ETF capital outflows and options traders increasing bets on volatility. Institutions warn that technical support for bitcoin above $90,000 is weak.
When traditional financial markets fail, will the crypto industry become a "pressure relief valve" for liquidity?
As long as the system continues to recycle debt into asset bubbles, we will not see a true recovery—only a slow stagnation masked by rising nominal figures.
A Quiet End to 2025 Could Prime Crypto for a 2026 Breakout, Analysts Say