
Pi Coin Dip Buyers Step In—but Only Big Money Can Stop the Breakdown

By:BeInCrypto
Pi Coin price is up a little over 1% in the past 24 hours, but it still trades more than 20% lower over the last three months. The downtrend has not reversed, yet something has shifted. A breakdown was forming on the chart, but dip buyers have stepped in at the last possible moment. Now, only big money can confirm whether this survival attempt becomes a strong rebound, or if Pi Coin goes right back toward the breakdown zone. Dip Money Tries to Hold the Line Between December 19 and December 25, the price of Pi Coin trended lower. At the same time, the Money Flow Index (MFI), which tracks whether capital is entering on dips, made higher highs. That is a bullish divergence. It suggests dip buyers are absorbing sell pressure before it can trigger a full breakdown. Dip Buying Continues: TradingView The divergence isnt cosmetic. The MFI curled upward at the exact moment the Pi Coin price started moving toward the neckline of its head and shoulders pattern. That pattern still points down, but the reaction in MFI helped prevent the immediate breakdown. Only Big Money Can Turn the Price Right Side Up This is where the Chaikin Money Flow (CMF) enters. CMF tracks big money flows. It measures whether deep liquidity and larger orders are actually entering the market. Pi Coins CMF has broken above its descending trend line and is now aiming for a zero line break for the first time since mid-November. For this attempt to flip the structure right side up, CMF must close above the zero line. The last time CMF did this was between November 14 and November 16. When that occurred, Pi Coin rallied by 10.76% in the subsequent sessions. Pi Coin Sees Big Money Flows: TradingView The structure is similar at present, but confirmation is lacking. Without CMF above zero, the move stays incomplete. The PI price chart is paused mid-pivot. Pi Coin Price Levels That Decide Everything The neckline of the head and shoulders pattern sits near $0.182. As long as Pi Coin holds above this line, the bearish structure remains unconfirmed. A move above $0.218 would mark a 6% push higher and break above the right shoulder of the pattern. That would weaken the breakdown thesis and signal that the CMF shift is real. Below $0.192 (the warning level), the breakdown story restarts. A daily close under $0.182 (11% down) confirms the neckline break, opening the door to a measured move toward $0.137. That is the 25% risk implied by the head-to-neckline measurement. It is not guaranteed, but the math is not forgiving. Pi Coin Price Analysis: TradingView For now, the Pi Coin price is caught between dip money and big money. MFI has already acted. CMF still hasnt. Not fully. Until both align, Pi Coin is suspended between survival and continuation. Read the article at BeInCrypto
0
0
Disclaimer: The content of this article solely reflects the author's opinion and does not represent the platform in any capacity. This article is not intended to serve as a reference for making investment decisions.
You may also like
Hong Kong Charts New Course to Shape the Crypto Landscape
Cointurk•2025/12/25 18:51
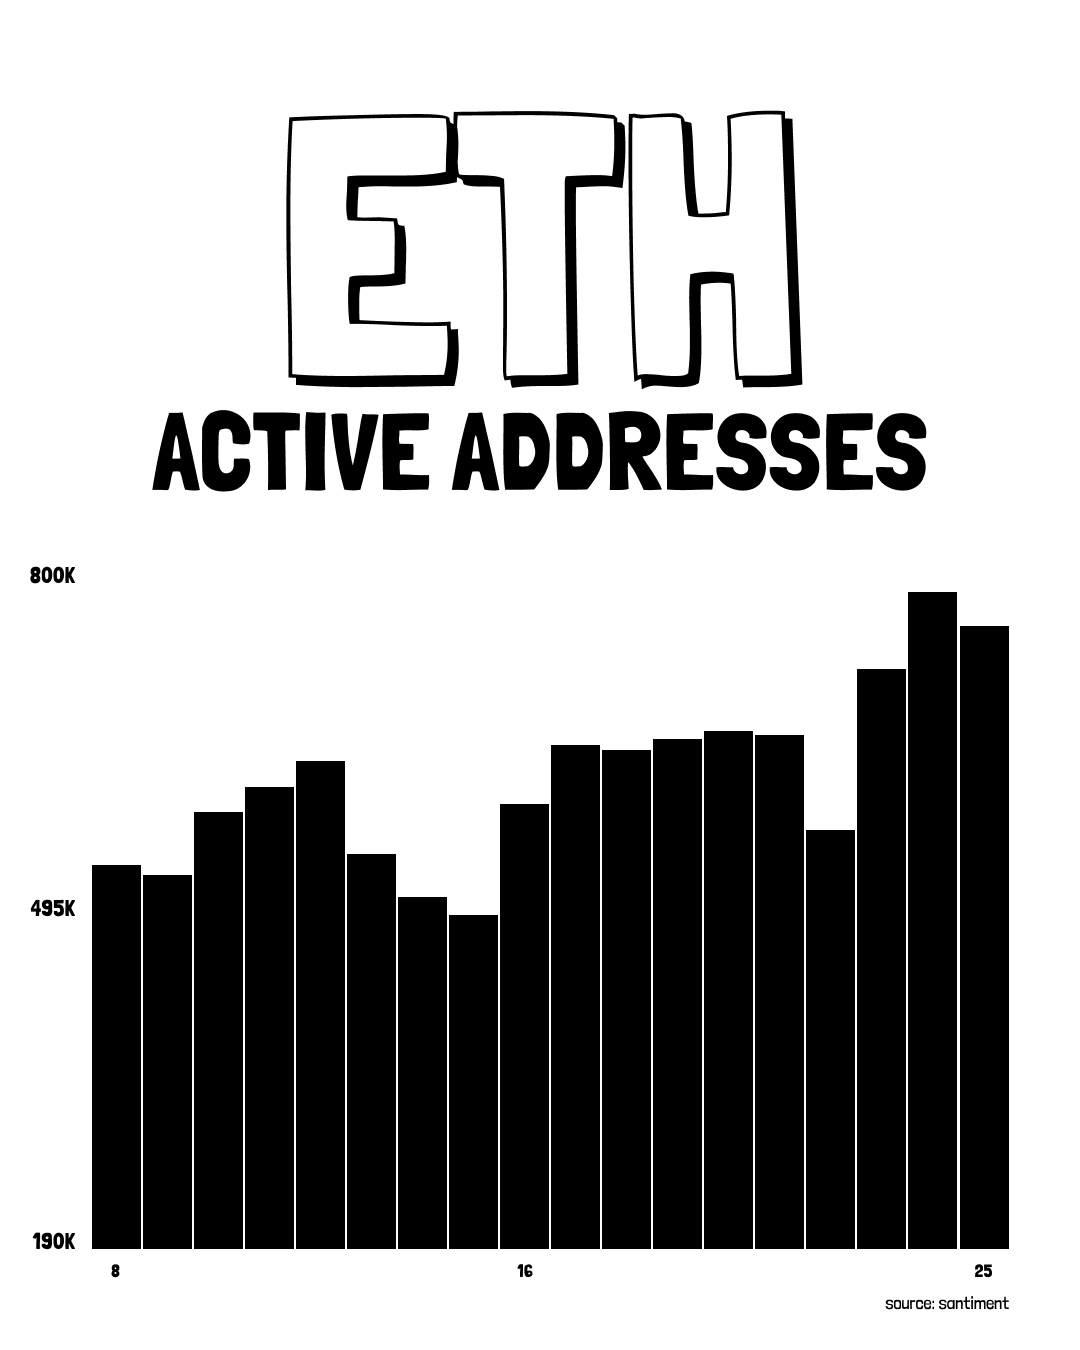
Ethereum (ETH) Network Activity Surges — Could This Fractal Setup Signal a Rebound?
Coinsprobe•2025/12/25 18:42
Whales Try Playing Zcash Price Santa — But Can The Rally To $655 Arrive In Time?
BeInCrypto•2025/12/25 18:42
Solana Trades at $126 as Sell Wall Caps Moves Toward $135
Cryptonewsland•2025/12/25 18:33