Bitget App
Trade smarter
MarketsTradeFuturesEarnSquareMore
Is XRP in an Accumulation Zone Before a Bullish Reversal? This Pattern Formation Suggests So!

Is XRP in an Accumulation Zone Before a Bullish Reversal? This Pattern Formation Suggests So!

CoinsProbeCoinsProbe2025/12/07 15:03
By:Nilesh Hembade

Date: Sun, Dec 07, 2025 | 12:55 PM GMT

The broader altcoin market continues to struggle for momentum, and XRP has been no exception. After reaching an impressive July peak of $3.66, XRP has corrected by 28% over the last 60 days, pulling back into a critical price pocket. Yet, behind the surface-level decline, the weekly chart hints that this drop may be less of a breakdown and more of an accumulation phase before the next directional move.

Is XRP in an Accumulation Zone Before a Bullish Reversal? This Pattern Formation Suggests So! image 0 
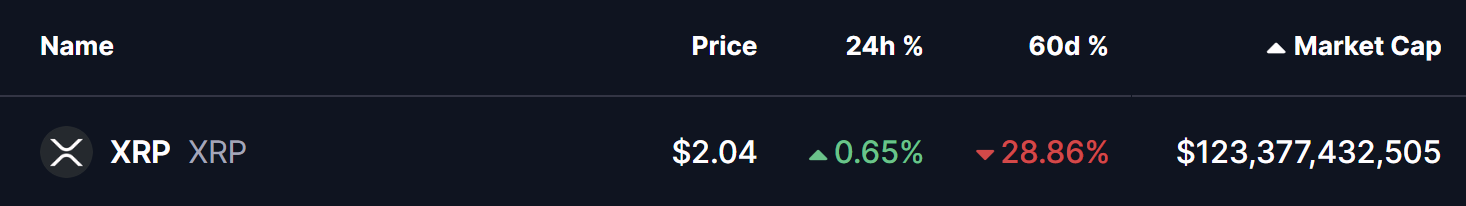
Source: Coinmarketcap

Key Pattern Hints at Potential Bullish Reversal

On the weekly view, XRP is trading inside a right-angled ascending broadening formation — a structure known for expanding volatility, multiple swing tests, and eventual strong directional breakouts. The earlier rejection from the upper resistance near $3.66 triggered a sharp 43% pullback, but importantly, price found its way back to the historically defended demand region.

This drop has cooled off overheated conditions and aligned XRP back into its broader consolidation highway rather than showing signs of trend collapse.

Is XRP in an Accumulation Zone Before a Bullish Reversal? This Pattern Formation Suggests So! image 1 
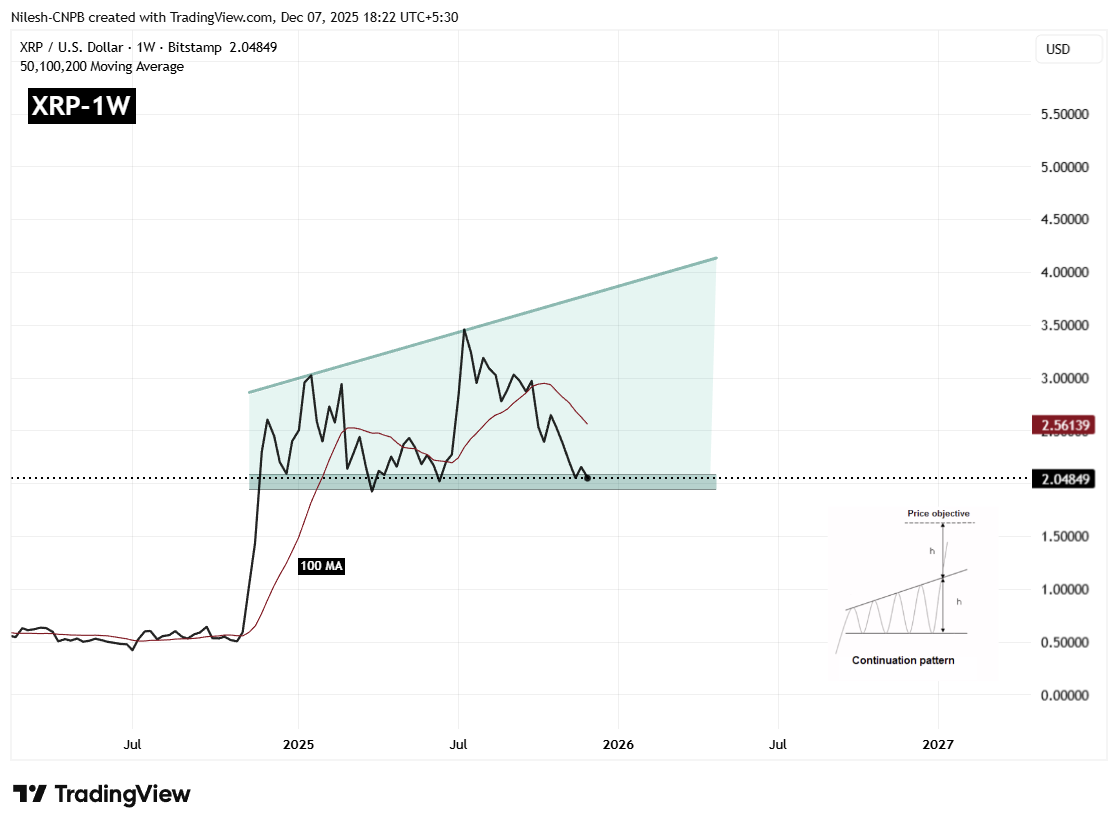
XRP Weekly Chart/Coinsprobe (Source: Tradingview)

The current zone between $1.90–$2.10 remains the key accumulation shelf. Every revisit to this range throughout the pattern has been met with strong defensive buying. That consistency shows not just passive support, but active absorption — a sign that large hands could be positioning, not exiting.

What’s Next for XRP?

Momentum remains fragile short-term, but structurally constructive. If XRP can continue holding above the wedge base and reclaim the 200-MA zone near $2.56, the next leg of upside rotation may begin, targeting:

• Ascending resistance trendline: ~$4.10
• Breakout implication: Potential continuation toward a new high territory

A successful breakout from the upper wedge boundary would likely confirm the next major bullish cycle for XRP, placing it back into an extended continuation phase.

However, the downside still matters. A clean breakdown below $1.90 would threaten the current wedge structure and shift the bias toward deeper retracement levels heading into Q1 2026. Until that happens, the market remains in a neutral-to-accumulation stance rather than a breakdown narrative.

For now, XRP sits in a decision pocket — where buyers have historically stepped in with conviction, and where the next directional trend for the asset could be quietly forming.

0
0

Disclaimer: The content of this article solely reflects the author's opinion and does not represent the platform in any capacity. This article is not intended to serve as a reference for making investment decisions.

You may also like

The CFTC-Authorized Clean Energy Marketplace: An Innovative Gateway for Institutional Investors

- REsurety’s CleanTrade platform, CFTC-approved as a SEF, addresses clean energy market illiquidity and opacity by centralizing VPPAs, PPAs, and RECs. - Within two months of its 2025 launch, it attracted $16B in notional value, enabling institutional investors to streamline transactions and reduce counterparty risk. - By aggregating market data and automating compliance, CleanTrade enhances transparency, aligning with ESG priorities and regulatory certainty for institutional portfolios. - It democratizes a

Bitget-RWA2025/12/10 09:32
The CFTC-Authorized Clean Energy Marketplace: An Innovative Gateway for Institutional Investors

SOL Drops 50%: Is This a Healthy Market Adjustment or the Onset of a Major Sell-Off?

- Solana's 50% price drop sparks debate over whether it signals a bear market correction or deeper structural selloff. - On-chain metrics show liquidity contraction and reduced exchange supply, but ETF inflows and validator activity suggest structural resilience. - Corporate transfers and the Upbit hack highlight volatility risks, while Solana's alignment with Bitcoin's trend underscores macroeconomic influence. - Key watchpoints include liquidity recovery timelines, ETF inflow sustainability, and potentia

Bitget-RWA2025/12/10 09:32
SOL Drops 50%: Is This a Healthy Market Adjustment or the Onset of a Major Sell-Off?

Navigating the Fluctuations of Bitcoin in Late 2025: Adaptive Risk Management Approaches for an Evolving Cryptocurrency Landscape

- Bitcoin's November 2025 price swung between $80,553 and $91,000, eroding 25% of value amid macroeconomic and regulatory pressures. - Volatility stemmed from technical breakdowns, leveraged liquidations, and market makers' gamma exposure shifts below $85,000. - U.S. GENIUS Act and EU MiCA framework provided regulatory clarity, boosting institutional adoption through compliant ETPs and stablecoins. - Investors adopted risk-rebalance strategies: options hedging, macro-adjusted DCA, and diversified crypto tr

Bitget-RWA2025/12/10 08:56
Navigating the Fluctuations of Bitcoin in Late 2025: Adaptive Risk Management Approaches for an Evolving Cryptocurrency Landscape
© 2025 Bitget