Date: Sun, Nov 16, 2025 | 12:00 PM GMT
The broader crypto market is showing some weekend relief after a heavy mid-week sell-off that pushed Ethereum (ETH) down to $3069 before recovering back near the $3200 zone.
Hyperliquid (HYPE) is also attempting a recovery, printing modest gains today — but the real focus is on the clear harmonic structure developing on its chart, which is hinting that a potential upside move may soon unfold.
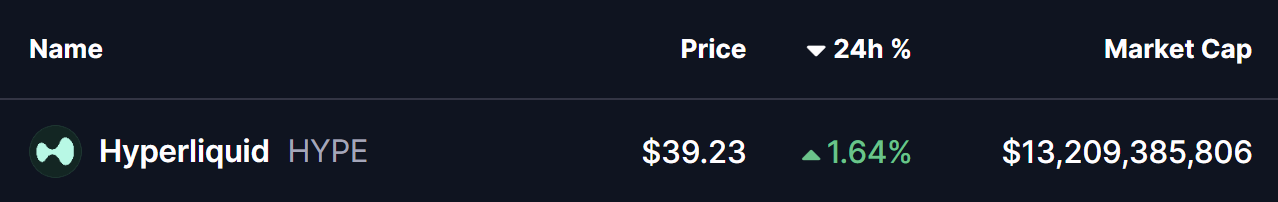 Source: Coinmarketcap
Bearish Bat Pattern in Play?
On the 4-hour chart, HYPE appears to be forming a Bearish Bat harmonic pattern. Despite the name, the pattern often leads to a bullish push toward the completion point (D) before a reversal takes place.
This structure began at Point X near $50.170, followed by a steep drop to Point A, a bounce to Point B, and then a deeper correction into Point C around $36.002. From this low, HYPE has started to steadily rebound and is currently trading near $39.31, showing early signs of building momentum.
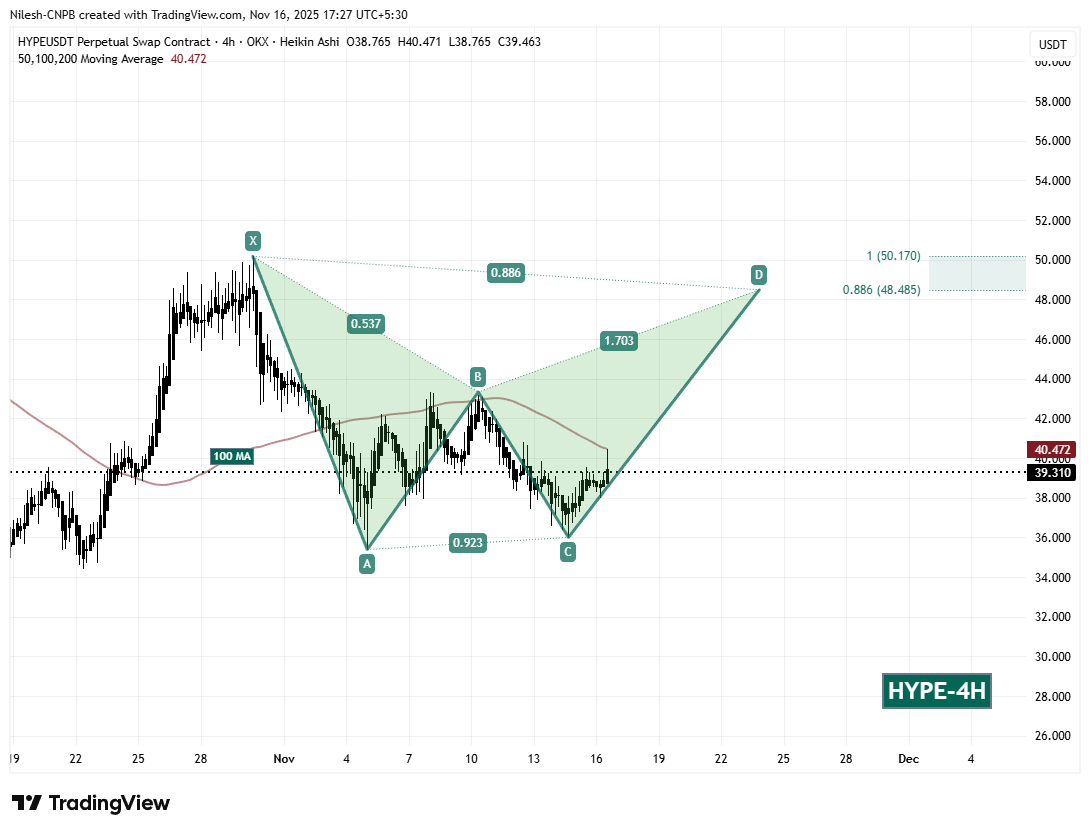 Hyperliquid (HYPE) 4H Chart/Coinsprobe (Source: Tradingview)
Supporting this developing move is the 100-hour moving average, currently positioned around $40.472. Reclaiming and holding this level will be an important signal of strengthening buyer conviction.
What’s Next for HYPE?
If bulls continue to defend the $36 support region and manage to flip the 100-hour MA into support, the Bat pattern suggests a potential rally toward the PRZ (Potential Reversal Zone) between: $48.485 (0.886 Fib extension) & $50.17 (1.0 Fib extension).
This projected zone represents an upside of roughly 27% from current levels, and it aligns perfectly with classic harmonic completion zones where price often reacts strongly.
However, if HYPE slips below the support within the CD-leg, the momentum behind the pattern may weaken, delaying the bullish scenario and opening room for a short-term correction before any fresh attempt to push higher.